TXN: Fab-ulous FCF growth

Introduction

Texas Instruments (Ticker: TXN) is one of the largest manufacturers of analog and embedded chips. Analog chips process real world signals into something usable in the digital world. Think sound, temperature, pressure and light. They are cheap to make, but once customers choose a chip for their product they don’t tend to change them. Embedded chips sense, control, connect and process data. Think industrial robots, automotive sensors, appliances.

TXN enjoyed a pandemic-fuelled boom, but after global supply chains and demand returned to normal levels, customers were flush with inventory and demand dropped off. Then automotive and industrial markets also fell, affected by high inflation and central banks’ responses by raising interest rates. TXN pivoted in the past decade to focus on these two markets, which now make up about 70% of its business, and so it is keenly feeling the cyclical downturn.

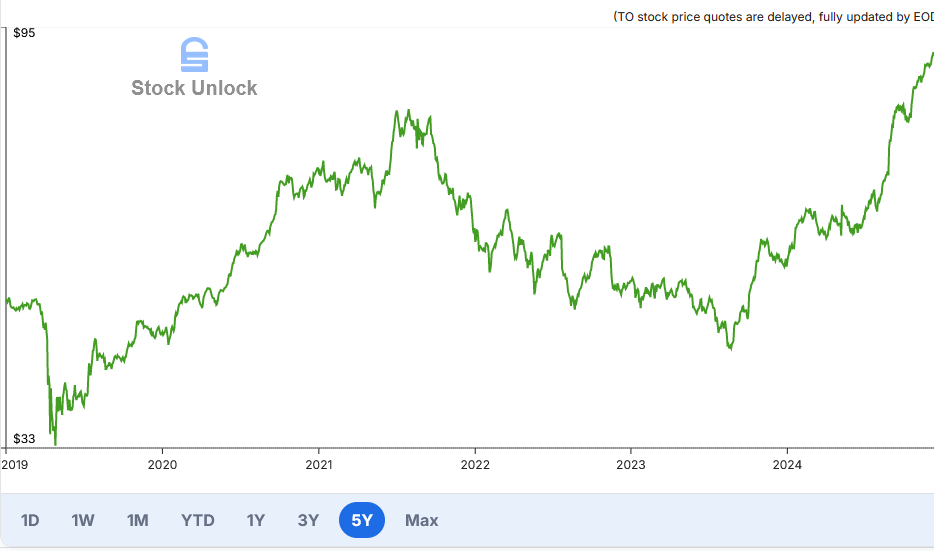
Nevertheless, the long-term outlook is favourable, driven by rising demand for both existing and novel / new applications. TXN has also undertaken a large counter-cyclical investment to build out its manufacturing capabilities while taking advantage of attractive funding under the US CHIPS Act. With this coming to an end, the stock trading down about 20% off all time highs and approaching 52-week lows, and some interest from a fellow investor, I decided to review my valuation.

Situation Overview

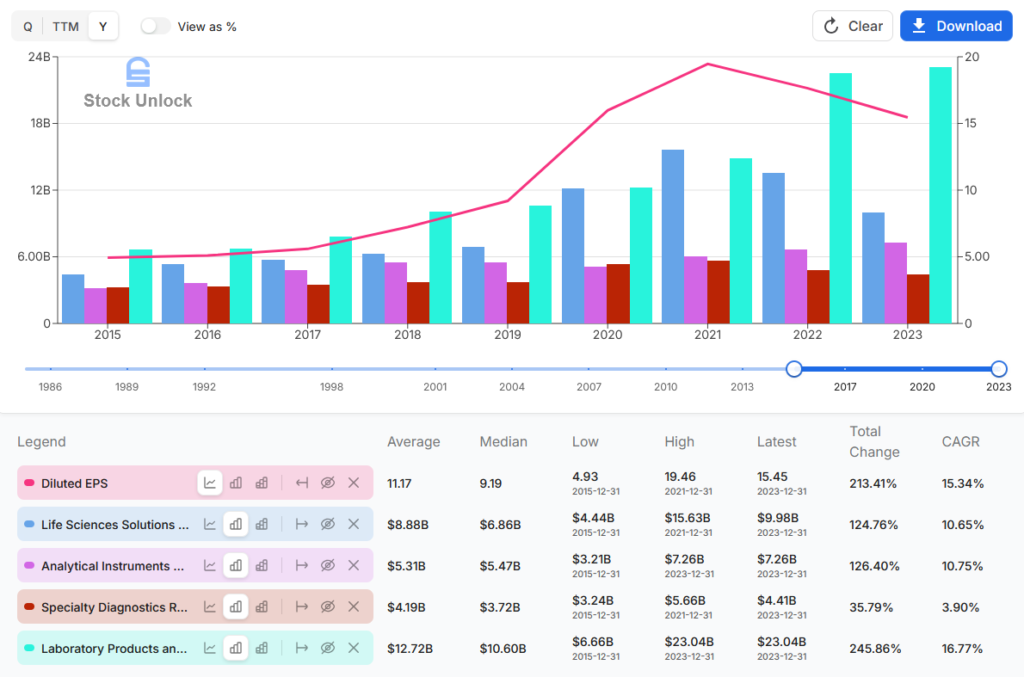
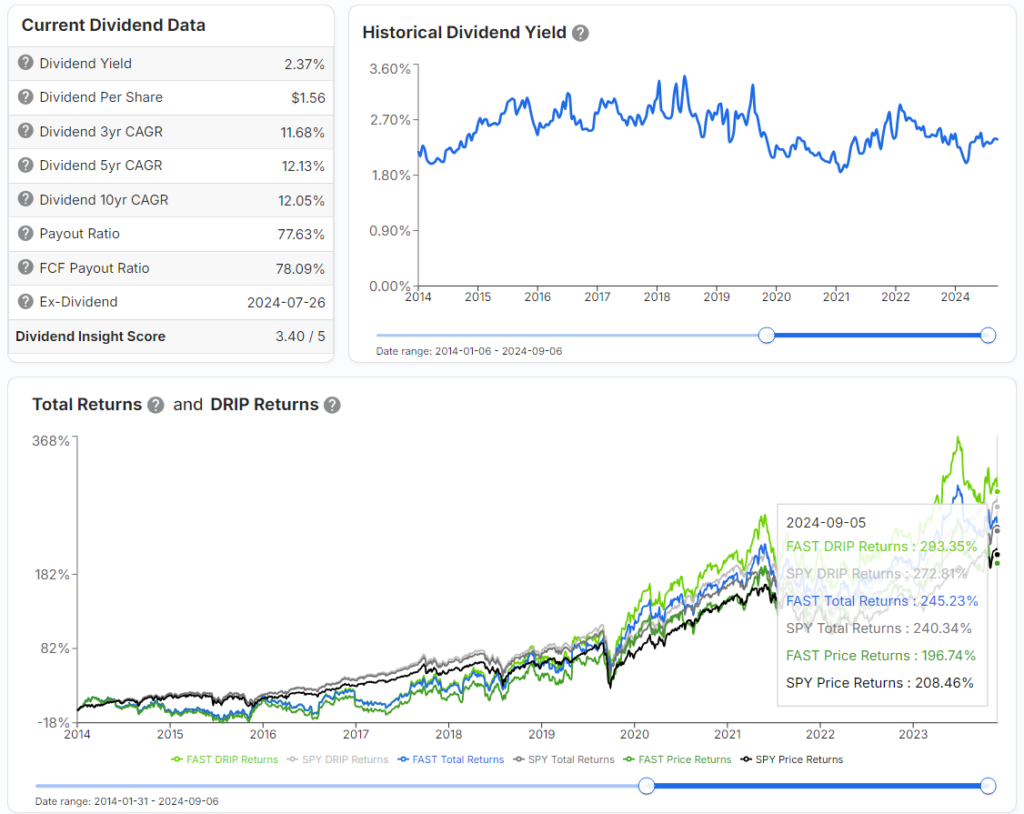
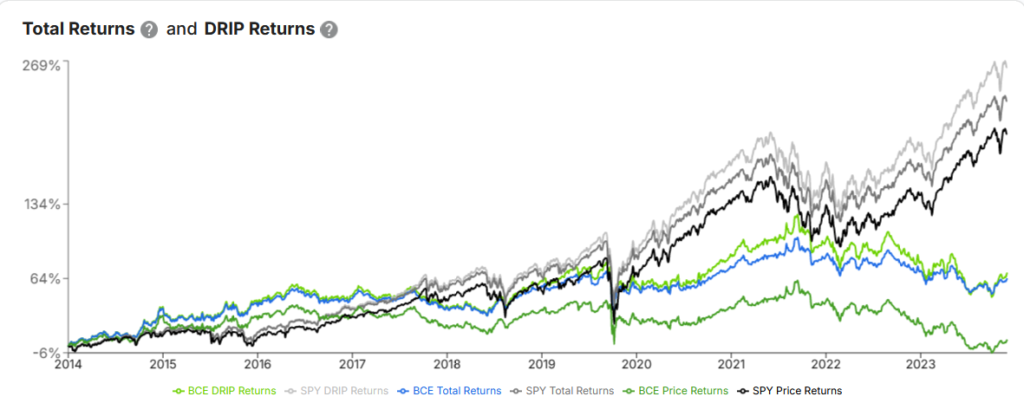
I’ve owned TXN for almost a decade. Over this time, initial purchases have returned some 3x or almost 12% CAGR. The position has grown to about 15% of my portfolio, and it’s one I’m comfortable growing, due to the importance of its product in so many applications; its focus on quality and bringing manufacturing in-house; and management’s guiding principle of growing free cash flow per share.

This is front and centre of their investor relations page: “The best measure to judge a company’s performance over time is growth of free cash flow per share, and we believe that’s what drives long-term value for our owners.” quoting Rich Templeton, Chairman and former CEO who oversaw operations from 2004 to 2023 when COO Haviv Ilan took over. Templeton was fundamental to creating the TXN of today.

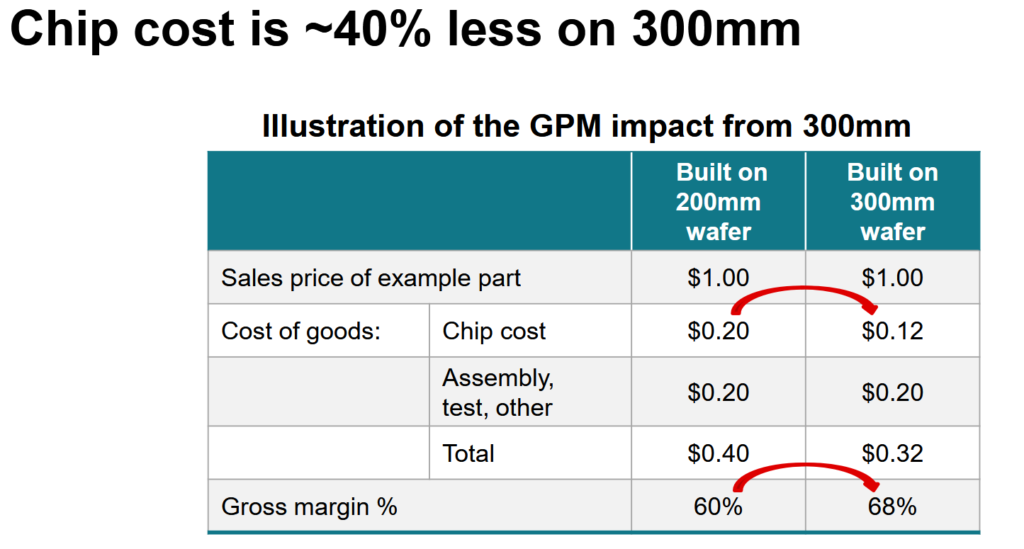
Templeton oversaw a period of significant FCF growth, enabled by TXN manufacturing chips on a 300mm wafer instead of 200mm wafer. This larger wafer enables a 40% cost improvement that drops to gross margin, and produces 2.3x more chips per wafer:

This shift was coupled with a counter-cyclical investment in capacity in the early 2000s, which was built in a modular way to better match investment with demand. This facility was RFAB1, and it sat unused for nearly 5 years. Then TXN bought equipment from a bankrupt competitor for pennies on the $ during the financial crisis, enabling it to complete RFAB1 cheaply and match investment with demand, which by 2010 had started to grow again.

This all stopped after the pandemic, however and the stock has underperformed as a result.

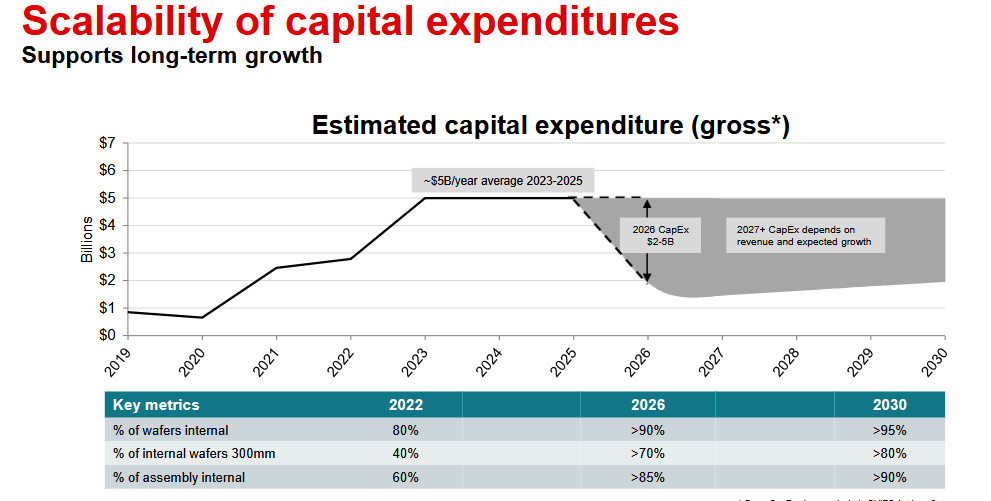
In 2022, management announced a huge counter-cyclical investment to build out their own chip manufacturing sites in the US, known as “Fabs”. Specifically, they would build 6 new 300mm fabs, spending $5B/year through 2026 and slightly less through 2030 to almost triple capacity by 2030. This is a staggering amount of money and was couched as intending to bring in-house more fab capacity, make more on the 300mm wafer, bring more capacity into geopolitically desirable control (TXN controls almost 50% of non-China+Taiwan semiconductor capacity), and to a lesser extent, take advantage of attractive CHIPS Act funding (direct cash + investment tax credits) to position the company to dominate over the next 10-15 years by having the capacity to meet demand at a level far exceeding any other semiconductor company.

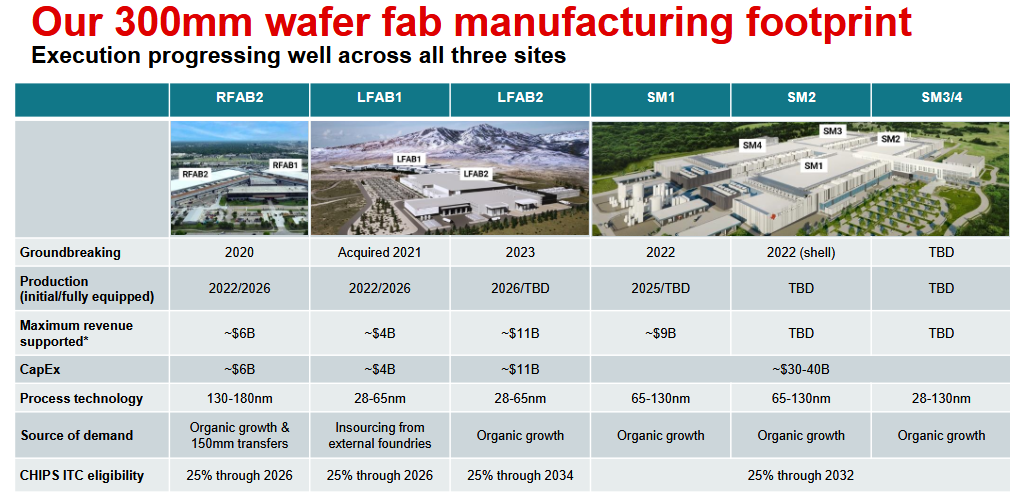
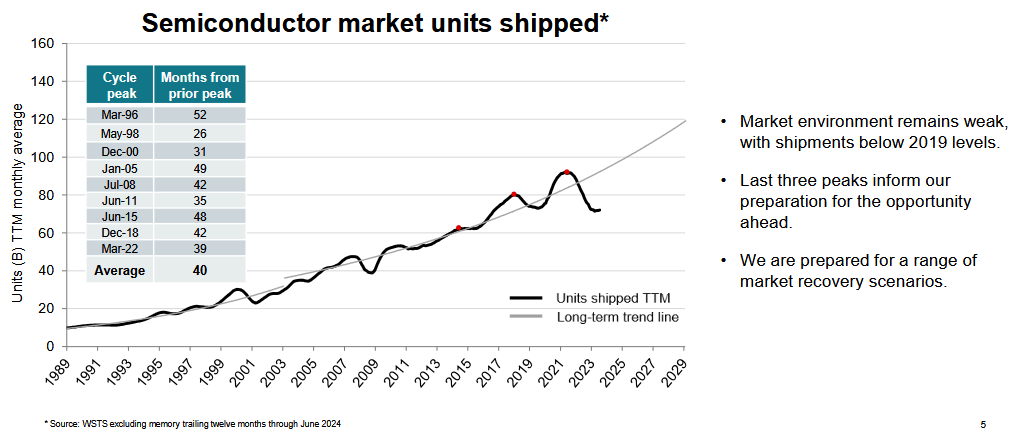
Sure sounds good, especially as TXN has lost market share throughout and after the pandemic. The problem is, the industry is in the deepest and longest cyclical troughs ever experienced, and long-term demand expectations suggest TXN’s capacity would exceed this by a staggering 50%!

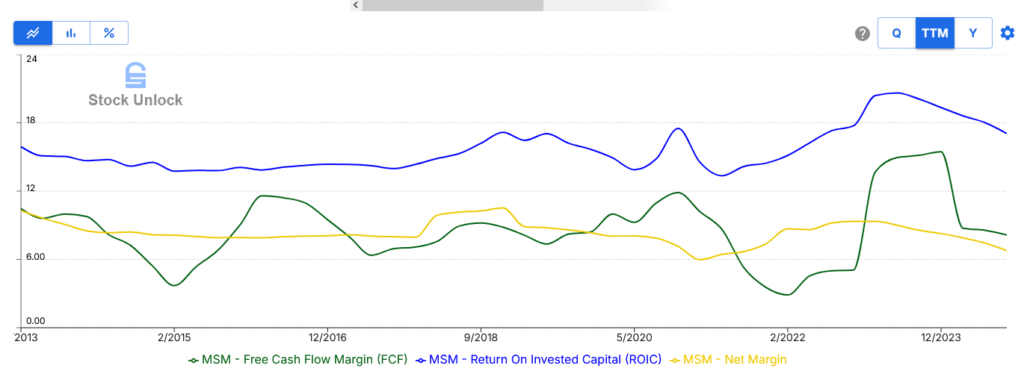
Recent results also show that current management have eschewed the longstanding focus on FCF/share, despite regularly extolling this as their guiding principle.

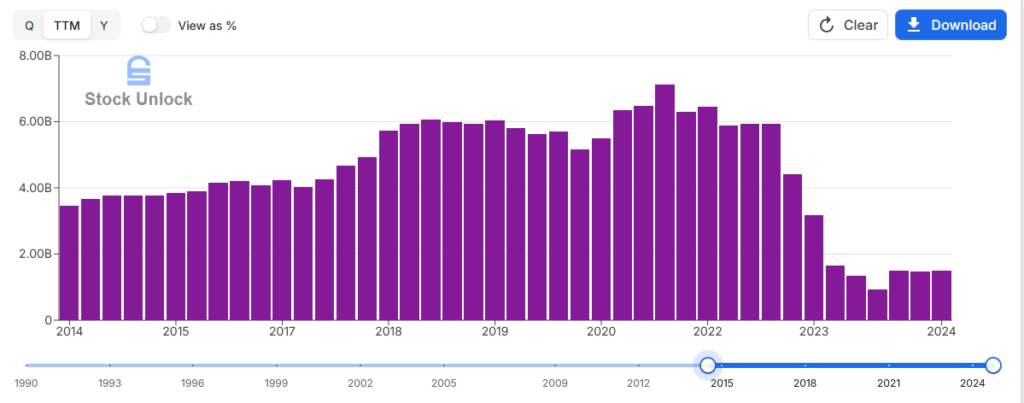
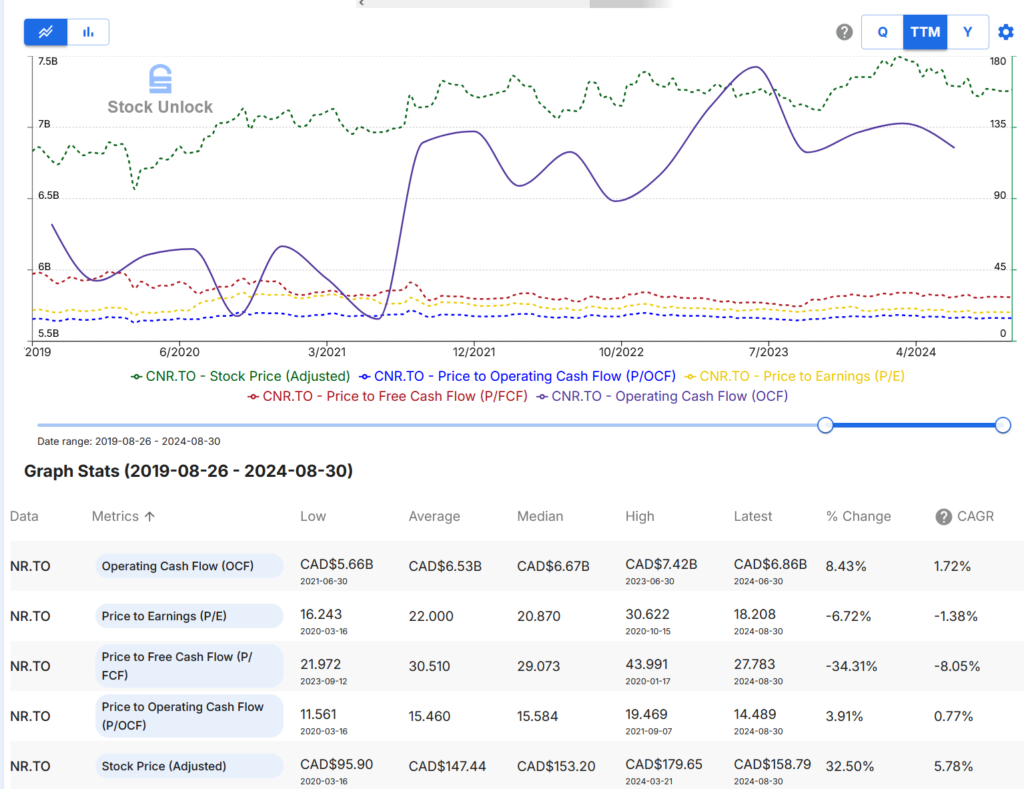
Stock Unlock: TXN Stock Details – Cash Flow

I was admittedly concerned about these dynamics as the share price lagged peers, but willing to see through the fab investment on a long-term lens.

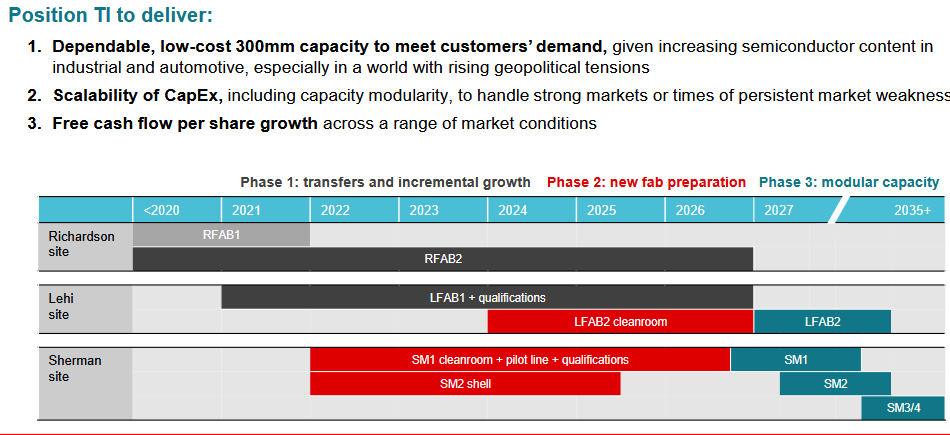
 I wasn’t going to add to my position, however, simply due to how much was being invested. These dynamics also led to Elliott Investment Management to take a $2.5B stake in May/24 and agitate the board to make changes. They respected TXN’s history, position as the industry leader in capacity, margins and historic returns, but were disappointed by the lack of clarity of when FCF/share growth would be back on the menu, as well as the more recent weak stock performance versus peers. The letter signatories included Jesse Cohn, apparently one that CEO’s never want to see on correspondence. Elliott asked, and got, the following: 1) reduce overall capex spend and adjust remaining investments to be flexibly responsive to additional demand by partially completing some of the fabs, and 2) return to the company’s legacy of growing FCF/share.

Time will tell, but for now I see myself aligned with Elliott’s intentions and am happy someone with more heft could make an impact.

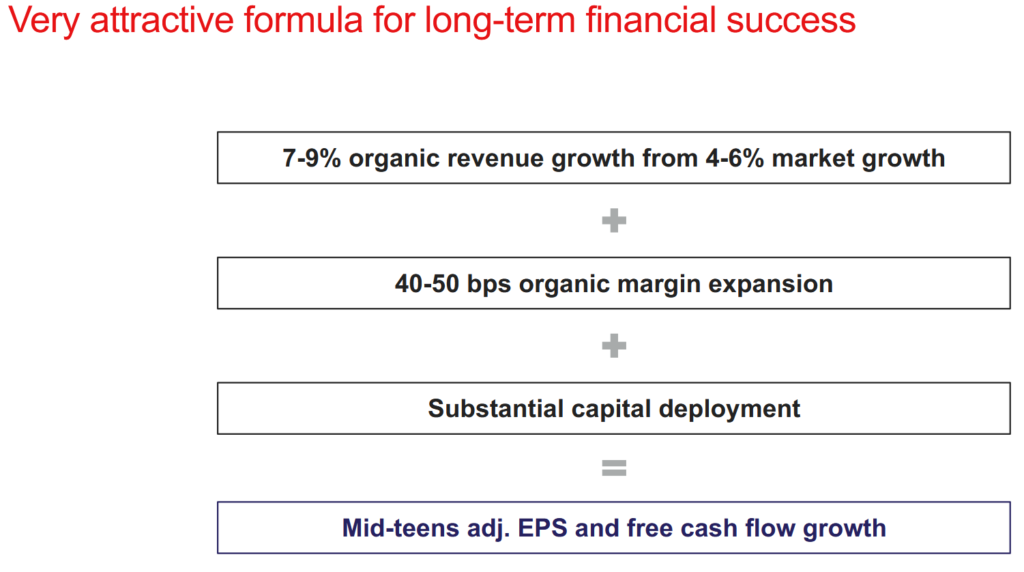
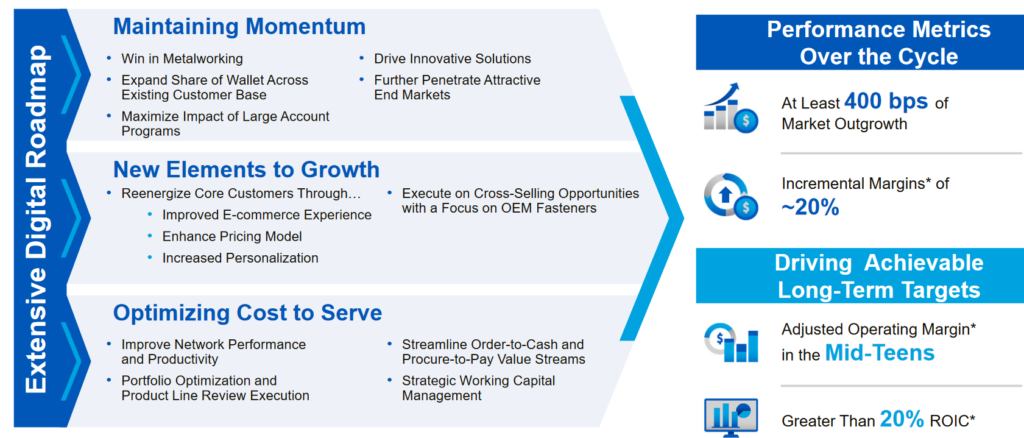
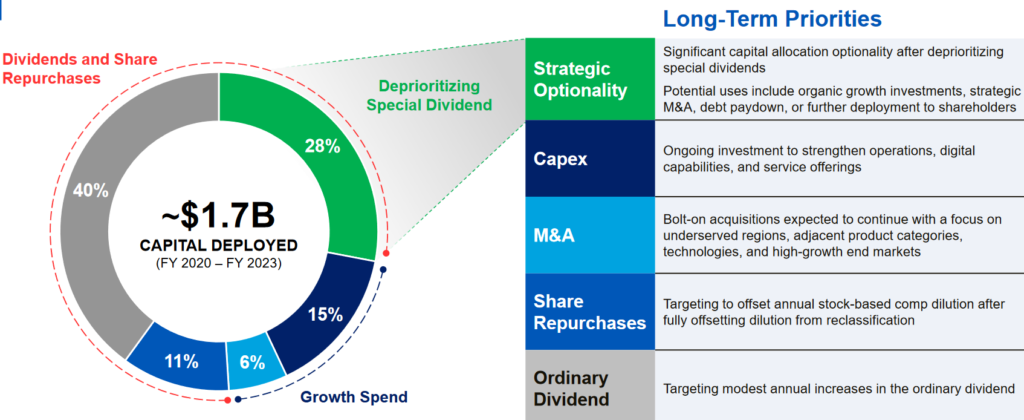
The revised approach is now clearly articulated in recent quarters’ investor presentation:

Implications for Valuation?

I started with their latest guidance for 2026, which covers four scenarios for growth between 2022 and 2026,ranging from no growth to 7% CAGR / 30% growth:

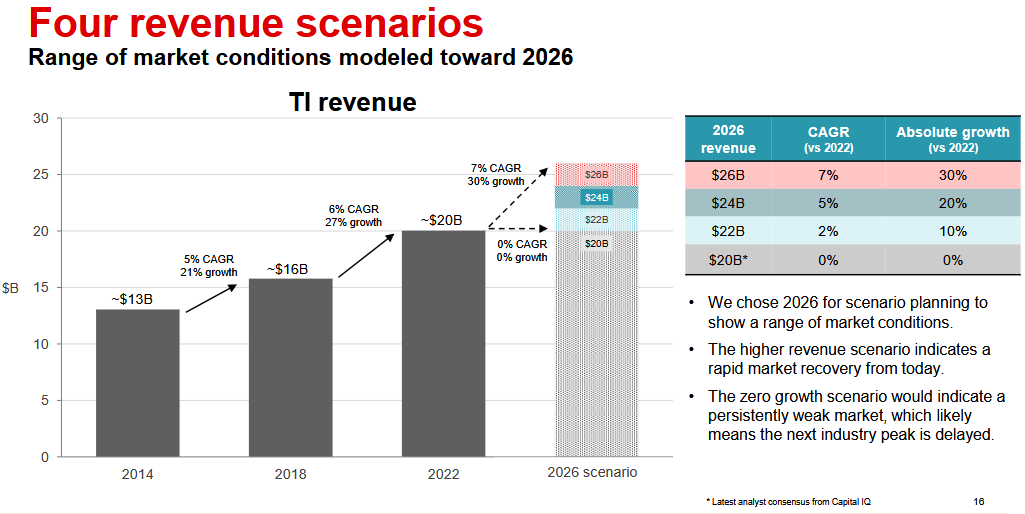
What I found intriguing is even in the no-growth scenario, FCF/share is estimated to be $8-9, with flexibility to meet demand if it’s higher than expected which is why capex is higher in those scenarios. Right now, FCF/share is $1.65 for 2024.

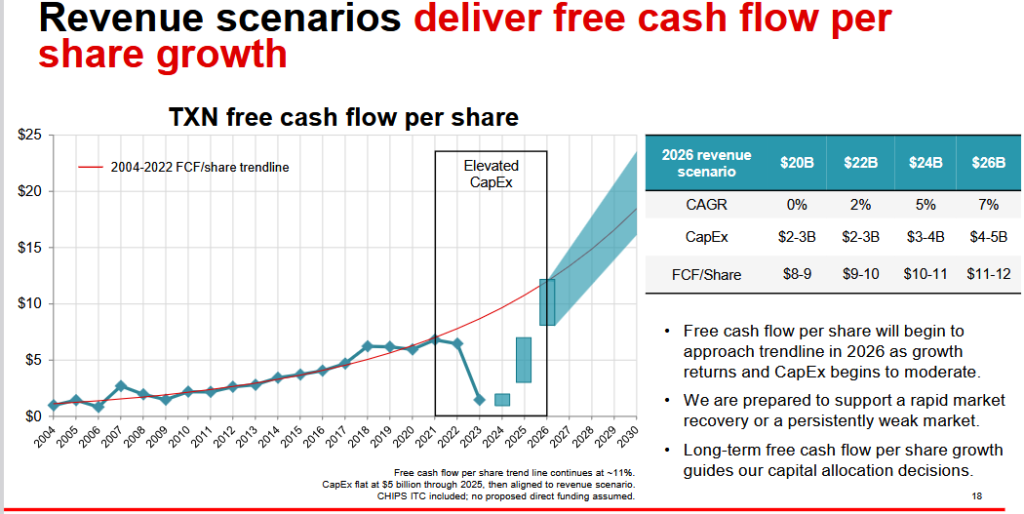
Alright, so a 5x in FCF in 2 years sounds pretty damn good, even if that’s a reduction in spending as opposed to business growth. I don’t think this point was overlooked and everyone should be aware of this though, since its so well telegraphed by the company. Plus I’m interested in a valuation over a longer-term, so I decided to look at a low growth case over 5 years from 2024 through 2029.

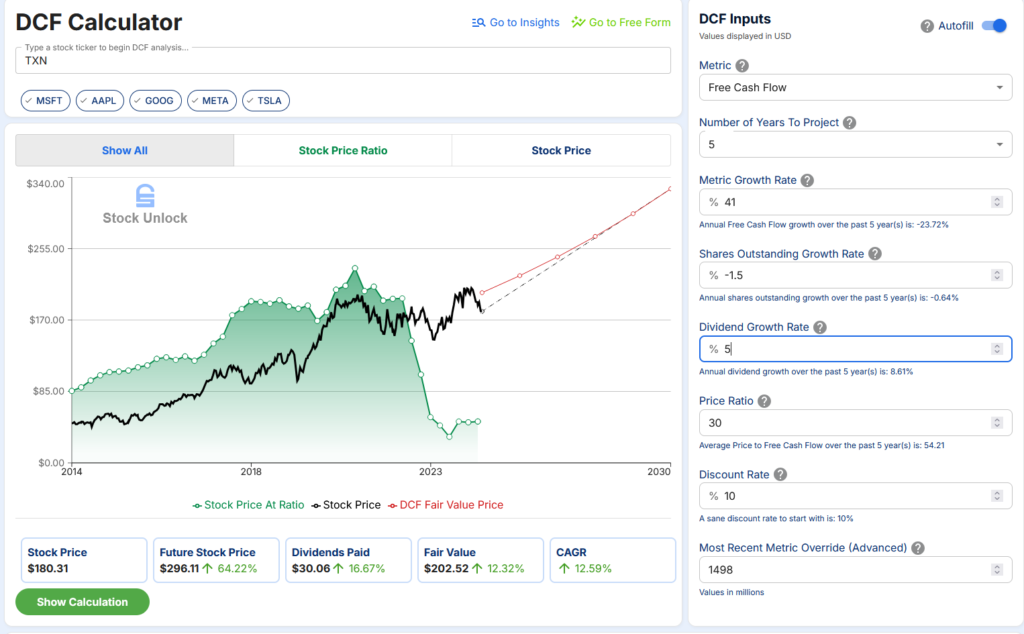
I assumed an average FCF/sh of $8.5 in the no-growth scenario, the midpoint, which is $7.8B by 2026 based on 912MM shares outstanding today (for simplicity I’m ignoring buybacks). I then assume that due to this type of environment growth is anemic at about 2.5% annually, which brings FCF to $8.3B by 2029, for a 2024-29 CAGR of 41%.

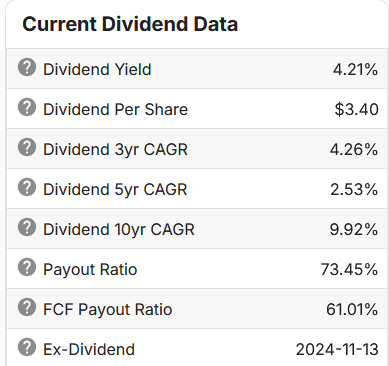
Management guided that all FCF will be returned to shareholders. With about $5.50/sh paid out now as dividends and assuming 5% growth annually through 2026, deducting dividends from the FCF leaves about $2.75/sh available for buybacks by 2026 or about 1.5% of all-time high share price. Similar to what they are buying back now.

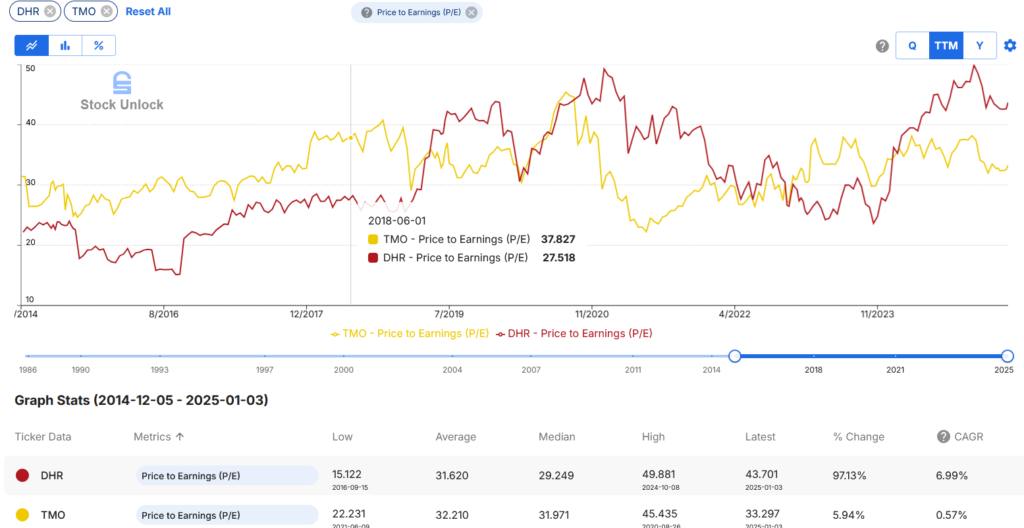
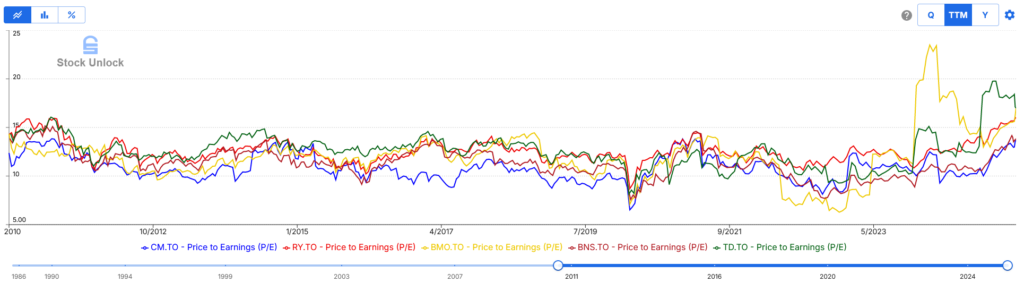
The FCF multiple is about 54x right now, owing to the depressed level of FCF. It’s also averaged 54x over the past 5 years, but this was a boom period. The 10-year average is about 37x and the median is 22x, so I cut the difference and assumed 30x.

This shows a potential 12% CAGR at current prices, with a FV of $202.5/sh for a 10% CAGR.

Stock Unlock: DCF Calculator

This obviously looks better if there is a boom, and there is further upside because it doesn’t include the $1.6B of direct funding under the CHIPS Act that will be received through 2030. This is another $1.75/sh of cash.

Ordinarily, I would use operating cash flow to value a company with a significant amount of investment resulting in variable or unreliable FCF. In this case, the company has guided pretty clearly what to expect in terms of FCF and supports using it for valuation.

Where Does This Leave Me?

I think we’re going to see a rising demand for TXN’s chips. As merely one example, EVs use 2-3x more analog chips than ICE vehicles. In the 1990s, average vehicle chip content was $30-50, and as of the 2020s, this has risen to $400-600 for ICE and $800-1500+ for EVs (or more for luxury or autonomous vehicles).

This doesn’t consider continued factory automation, replacing aging energy infrastructure, body electronics and lighting, autonomous driver systems (see continued AV investment by Uber, Waymo, and their ilk as an example), general/broad robotics, healthcare, and consumer products like AV/AR headsets being developed by META. Add on top of all this continued investment in AI and data centres, with associated requirements for electricity grid additions and new power generation, and the long term picture is attractive.

TXN is 70% through a massive investment program that will support the company for the next 10 to 15 years, with flexible capacity to respond to unanticipated market growth. Based on my FCF valuation, which assumes almost no growth, I’ll add to my position under $180/sh.

TMO – Shopkeeper to Science

Thermo Fisher Scientific (TMO) provides serves the healthcare industry, specifically providing a range of analytical instruments, equipment, reagents and consumables, software and services. Formed through the merger of Thermo Electron and Fisher Scientific in 2006, and operating in over 50 countries. Their market cap is over $200B as of writing. In late 2024 I swapped my holding in JNJ for TMO. This serves to summarize my thinking about TMO.

They operate four segments with leading positions in each:

Customers

Customers include pharma, biotech, hospitals, clinical diagnostic labs, universities and research institutions. I would describe TMO’s products as the ‘picks and shovels’ for healthcare.

Customers are diverse by geography and industry, with a notable, and expected, concentration in pharma & biotech:

Customer retention rates are high due to the mission-critical nature of products, long-term relationships often spanning decades, recurring revenue from consumables and services, integration in customers’ processes, and comprehensive post-sale support. After selling the equipment (17% of revenue), customers need the material to operate them on an ongoing basis, and will buy the consumables and services from TMO (83% of revenue). It’s simple to go to a single provider.

They prioritize customers and have “experience centres” to support them, e.g. New centre opened in Korea to support material sciences, specifically battery manufacturers. I like this additional business outside of healthcare.

Competition

Competitors include Agilent technologies, Waters Corp and Danaher in Life Sciences. Of these, only the last provides any sizeable threat with ~$170B market cap compared to TMO’s ~$200B. Over the past decade TMO has been able to:

  • Grow its FCF at a CAGR of nearly 14% (currently $7.8B for Q3/24 LTM vs. $5B for Danaher).
  • Grow EPS at a 13% CAGR vs. DHR’s 4%.

Competitors for diagnostics include Roche, Siemens Health and Abbott; and in Laboratory these include Merck, Sartorius and Eppendorf. No one perfectly lines up against TMO in terms of product offering, and for many EPS growth is on a similarly low trajectory as compared to TMO. I also prefer not having pharma exposure.

I was able to quickly comp competitors’ performance, easily from Stock Unlock’s Free Form Tool (unaffiliated link). For example, the valuation:

Operations

TMO is an acquisition machine, which has been its growth engine in the past decade-and-a-half.  Since 2010 they spent nearly $5B p.a. buying other companies. This was fuelled by cheap debt, which may become challenging where rates are now. Also, given its large size, additional acquisitions have a diminishing impact on growth.

It is a fragmented industry, however, and TMO has proven itself able to execute on M&A, consistently. Their largest acquisition recently was the $20B purchase of PPD in 2021. It is performing well, with new customer wins, increased customer retention and share of wallet, and synergy targets raised in 2023 now on track to exceed $200MM in operating income by year 3.

China is not an insignificant contributor to results, so slowing growth may be a concern but it is not the only country in Asia that TMO serves, nor is it the largest segment. The base is firmly North American:

Stock Unlock: Financials and KPIs for TMO

TMO claims to serve a $235B market with 4-6% long-term growth. End markets benefit from enduring long-term trends including:

  • Favourable demographics driving up demand for healthcare (aging)
  • Global population growth (by 2035, 1.2B will be >65 years old, +50% from 2023)
  • Ongoing advances in life sciences research
  • Funding momentum in pharma and biotech
  • Development of complex therapeutic modalities and customized patient demands
  • Material science breakthroughs growing semiconductors, advanced materials and energy transition

Financial Review

They focus on several pillars:

  1. Innovation
  2. Leveraging scale
  3. Creating value for customers

One can see they’ve benefitted from the Pandemic, which was a boon to  several segments, in particular the life sciences segment. This is flagging now that we’re several years on, but this is a small segment. It’s also been more than made up for since 2022 with the $17B acquisition of PPD, in the Lab Products segment:

Just as well its the smallest segment because it has the lowest operating margins in the mid-teens. Other segments are mid/high 20%, except life sciences which is mid-30%.

They’ve reported three quarters through 2024, and so far revenue stabilized around $42B on an LTM basis. They modestly raised the low end of EPS guidance, bought back $3B of shares and continued to complete acquisitions, using cash on hand. They also launched new specialized products.

The balance sheet is in good shape, with over $6B of cash and investments and $35B of long-term debt, and an A- credit rating.

Capital Allocation

I like the focus on EPS, FCF and per share metrics. Focus is on high-ROI organic opportunities, with M&A being the primary focus of capital deployment for 60-75% of capital. The remaining 25-40% would be returned via a modest dividend and buybacks.

Share buybacks are the primary means of returning capital. Indeed, In Q4/24 TMO bought $1B in stock under its then-recently authorized program of $4B, leaving another $3B available. Since 2015 it’s averaged $1.3B in buybacks annually, with nearly $12B+ bought back since 2020. Diluted share count is down from 403MM at the beginning of 2020 to 384MM as of Q3/24 (-5% total / -1% CAGR)

A small dividend is paid (0.3% yield as of writing), which has grown at 10%+ over the past 10 years. Investors are guided that it will increase consistently over time. It represents <10% of FCF. Given the source of returns comes from business growth, I’m fine with this capital allocation.

Valuation

Setting context for their trading multiples, when I first started looking at TMO last year, I felt it was trading at a fairly rich level of almost 38x earnings and 30x FCF. That was higher than the average over the past 10 years, which were around 32x and 27x, respectively.

It’s expensive on a P/E basis but roughly in line on a P/FCF basis when only looking back 5 years, but I think the Pandemic years are skewing that (avg 5yr P/E 33x and P/FCF 31x). I think it should trade somewhere between the shorter and long term averages, because it’s strikes me as a better positioned company now than it was since the pandemic.

Source: 2024 investor day presentation

They bought back ~1.5% of their shares in the past year, and a similar amount the year prior. Assuming they continue to buy back ~1% of shares annually, dividends grow at 10% per year (lower than historic rates, but they pay so little it doesn’t really affect valuation), applying a more reasonable historic P/E multiple of 30 and a 10% discount rate, I get a fair value of ~$508/sh with 10% EPS growth for a 3yr CAGR return of 7% CAGR. If earnings grow 15% per year, FV rises to ~$580 and returns improve to 11.5%.

If I do this on a FCF basis, they’ve been able to grow it by 10% over the long-term and guiding to continuing to do that. Again, I’m trying to back out any temporal boon from the pandemic. I don’t see why that couldn’t be possible, but assumed it would grow at a 8% CAGR. This would be $9.8B by the end of 2027 which is only ~$1.7B more than the pandemic peak, and still at a much lower growth trajectory than we’ve seen in the past 2 years. Using a P/FCF multiple of 29x, in between the short- and long-term averages I mentioned, I get a FV around $588/sh at a 10% discount, for a 3yr CAGR return of 12%.

Conclusion

I think TMO presents a compelling investment case based on its dominant market position, strong recurring revenue model, and proven M&A execution. While currently trading at a premium to historical multiples, the company’s consistent growth profile, robust cash flow generation, and exposure to secular growth trends in healthcare and life sciences support the valuation.

Key monitoring points include interest rate impacts on future M&A capacity, geographic expansion success, and maintaining margins amid competitive pressures. I swapped my holdings in JNJ for TMO around $530/sh.

The combination of mid-teens FCF growth, strategic acquisitions, and shareholder returns through buybacks suggests potential for 10-12% annual returns over a medium-term horizon with a margin of safety against my estimates valuation.

2024 Year End Update

Overview

As a journal for my thoughts and actions on investing, I’ve decided to record quarterly investment activities that don’t merit separate posts. I plan to write these reviews semi-annually, which aligns with my philosophy that investment actions, including updates, should be driven by necessity rather than calendar obligations.

Given that it is a new year, I also comment on portfolio performance in 2024.

Q4 2024 Portfolio Activity

Getting My Tech Off – Strategic Portfolio Exits in ENGH and OTEX

Two significant positions were closed during the quarter as part of my evolving investment strategy. Enghouse Systems (ENGH) and Open Text Corporation (OTEX) were divested, with proceeds redeployed to strengthen existing positions in Brookfield Corporation (BN), Brookfield Asset Management (BAM), and Toromont Industries (TIH).

Enghouse Systems, despite its strong financial metrics including high return on invested capital and debt-free balance sheet, faced increasing competitive pressures in its contact center business from behemoth Microsoft (MSFT). While the company has successfully transitioned toward software-as-a-service revenue models, its growth remains heavily dependent on acquisitions. The emerging threat from artificial intelligence in the contact center space, combined with significant key person risk in founder-CEO Sadler, led to my exit decision.

The Open Text position, initiated during a period of dividend-focused investing, no longer aligned with my current investment criteria emphasizing deep business understanding and sustainable competitive advantages. Frankly, I didn’t even pay attention to the company beyond a cursory examination of cash flow and dividends.

This is a practical lesson in being confident in one’s own process, or to invert that: to not blindly follow others. Of course it is fine to adjust what we do, and how we do it over time. Indeed, one should; the world is not static and we learn from experience. Chasing what others are doing because one doesn’t know what their approach is, however, is not a good recipe. Much like sailing without a rudder, one is subject to the vagaries of the blowing wind.

Healthcare Sector Repositioning

A strategic rotation within healthcare saw me exit Johnson & Johnson (JNJ), held since 2015, in favor of Thermo Fisher Scientific (TMO). While the long-term thesis on healthcare demand growth remains intact, TMO offers superior exposure to this trend through its “picks and shovels” business model, serving both healthcare and adjacent markets. This decision followed extensive analysis of TMO’s market position and growth prospects, which will be detailed in a forthcoming post.

Performance Review

Whilst acknowledging the limitations of calendar-year performance measurement, the portfolio generated the following returns in 2024:

Unregistered Accounts: 12% to 24%

Registered Accounts: 19% to 36% (with one account at 2% due to underperforming REIT exposure)

These results compare favorably to major indices:

  • Toronto Stock Exchange (TSX): 18%
  • NASDAQ: 29%
  • S&P 500: 23%
  • Dow Jones Industrial Average (DJIA): 13%

Given that I have a mix of stocks across all these, few tech stocks, a broad comparison feels relevant. Performance is particularly noteworthy given limited exposure to technology stocks and complete absence of the “Magnificent Seven” companies that drove significant index returns.

Investment Philosophy Evolution

My investment approach has evolved meaningfully from its dividend-focused origins. This evolution began after studying various dividend-focused strategies, including those emphasizing tax-advantaged eligible dividends in Canada. While such approaches can and have indeed succeeded, I’ve concluded that they might sacrifice substantial capital appreciation potential and create unnecessary complexity through over-diversification. This reflection led to a significant refinement of my investment approach.

My current strategy targets a 9% compound annual growth rate, focusing on high-quality businesses I can hold for extended periods. This target would double invested capital every eight years. Dividend income, while welcome, is no longer my primary consideration.

Thus, having moving away from both pure dividend targeting and “cigar butt” value investing, I am instead emphasizing:

  • Companies with sustainable competitive advantages
  • Businesses I deeply understand
  • Opportunities for long-term value creation
  • Management teams with strong capital allocation skills

Looking Forward

The portfolio’s strong performance in 2024 seems to validate my refined investment approach, but I recognize it is only a single year. More importantly, a clearer investment philosophy and improved analytical framework should better position me for future opportunities. I think I’ll maintain semi-annual communication cadence, supplemented by specific investment analyses when warranted.

Good luck to all and enjoy the ride!

Learning Out Loud #1: Synthesis of Ideas on Decision Making, Life and Investing

As part of my learning journey, I regularly consume content from various sources including podcasts, books, and articles. This post synthesizes key insights I’ve gathered around three main themes: thinking probabilistically, living authentically, and investing wisely. These notes reflect both direct insights from experts and my own reflections on applying their wisdom. I will continue to post these reflections as “Learning Out Loud”.

Thinking in Probabilities

Making good decisions requires understanding probability better than our intuition suggests. Consider a common scenario: an accomplished home cook deciding to open a restaurant. While their cooking skills might suggest an 80% chance of success, industry statistics show that most restaurants fail in their first year. This base rate should adjust our confidence downward to perhaps 60% – still optimistic, but tempered by reality.

Destination analysis helps refine these probabilities further. For any future expectation, we should ask: What specific events need to occur? What must not happen? For example, in our restaurant scenario, success might require:

  • Maintaining consistent food quality at 5x the volume
  • Finding and retaining reliable staff
  • Managing costs while maintaining margins
  • Building a loyal customer base within 6 months

These become trigger points for feedback loops – clear signals that can validate or challenge our thesis along the way. Rather than waiting years to judge success, we can monitor these specific indicators monthly or quarterly. This can apply to investments that are usually considered to need a long time horizon to determine success, e.g. VC investing. Instead of assuming one has to wait the [7-10] years to realize whether the investment was a success, one should use as trigger points the elements they were going to assess the investment in the meantime. It isn’t as though the VC invests and goes to bed for a decade, they will monitor sales, cash burn, management decisions, etc. Those should be used then !

This probabilistic thinking extends beyond business decisions. Whether investing, career planning, or making life choices, we can improve outcomes by:

  1. Starting with base rates from similar situations
  2. Identifying our specific edge or advantage
  3. Setting up clear feedback loops
  4. Maintaining a margin of safety to account for uncertainty

The key is making these components explicit and trackable, preventing after-the-fact rationalization of outcomes.

Living a Full Life: Principles for Authentic Living

On Personal Authenticity

The fundamental challenge of living well starts with being true to oneself. This means not just understanding who you are, but actively embracing it. We must sometimes give up what we want our destiny to be to find out what it is. This requires both courage and humility – courage to be authentic, and humility to let go of preconceptions about our path.

On Professional Conduct

There’s wisdom in considering how institutions like the royal family approach their roles. They demonstrate the power of ceremony, routine, and decorum. Yet this formality needn’t conflict with authenticity – indeed, many successful professionals find ways to be the same person both personally and professionally. This consistency builds trust and reduces the emotional burden of maintaining different personas.

On Relationships and Boundaries

Meaningful relationships require both generosity and boundaries. The pattern is clear: help someone once, and they should reciprocate. If they continue asking without giving back, it’s time to reassess the relationship. This applies equally to our own behavior – we must be mindful of not becoming the person who constantly takes without giving, as illustrated by the anecdote of investors being careful not to always ask Warren Buffett for coffee while in Omaha.

On Purpose and Presence

Your most important job isn’t your career – it’s living a meaningful life. This requires being present in each moment rather than always seeking the next opportunity. At a conference, this means engaging with the content rather than chasing celebrity sightings. It means putting on your own “life jacket” first – ensuring your own well-being so you can better serve others. It is also important to know where you are going: “If a man knows not to which port he sails no wind is faovourable” – Seneca.

The Art and Science of Investing

Understanding Growth Drivers

At its core, investment returns come from three fundamental drivers: earnings growth, multiple expansion/contraction, and shareholder returns (dividends or buybacks). This framework helps cut through market noise to focus on what truly creates value over time.

This thought experiment illustrates the point. These two investments will net the same returns (all else being equal):

  • A company growing earnings 20% annually, and
  • A company with no growth and a 5x P/E multiple using 100% of cash flow to buy back its stock

The latter isn’t exciting, and likely easily overlooked, but is no less a compounder generating returns for one’s capital.

A Process-Driven Approach

Rather than trying to predict short-term market movements, successful investing requires a systematic approach focused on longer time horizons. The “invest, then investigate” method offers an interesting balance: take a small initial position when you spot a promising trend, then do deeper research to either build the position or exit. This approach recognizes both the speed of modern markets and the importance of thorough analysis.

Consider the case of investing in cyclical industries: conventional wisdom often warns against them, yet companies that can survive industry downturns while capacity decreases may emerge stronger during the inevitable upswing. This illustrates how thinking probabilistically about future scenarios, rather than just current conditions, can reveal opportunities.

The Power of Patience and Concentration

The most successful investors often make fewer, more concentrated decisions rather than constant trades. As Warren Buffett’s famous “20-hole punchcard” metaphor suggests, quality matters more than quantity. This patience shows in real-world results: Norway’s pension fund’s seemingly modest 6% CAGR has built nearly 60% of the fund’s $1.5 trillion in wealth, while Aquamarine fund’s 9% CAGR has created significant family wealth. These examples demonstrate how steady compounding through patient, focused investing often outperforms more active approaches.

Making Better Decisions

The Role of Conviction and Flexibility

Good decision-making requires a seemingly paradoxical combination: strong conviction with willingness to change. As one investor notes, “A very good investor is a contrarian with conviction, and being able to not listen to what others think, and yet being able to change one’s mind.” This applies equally to life decisions and investment choices.

Practical Decision-Making Tools

Several practical tools can improve decision quality:

  • Simple, clear documentation (1-2 page write-ups for investment decisions)
  • Regular journaling to track your thinking and establish personal base rates
  • Structured discussion with others, including designated devil’s advocates
  • Recognition that risk often manifests in counterintuitive ways

The Discipline of Inaction

Perhaps the hardest yet most important aspect of decision-making is knowing when not to act. We often feel compelled to take action – making trades, changing strategies, or making decisions – simply to feel productive. Yet some of the best decisions are choices to wait, observe, and let time work in our favor.

Integrating These Principles: A Framework for Better Decisions

Whether in investing, career choices, or personal life, these themes interconnect in powerful ways:

1. Probabilistic Thinking Applied Broadly

  • In Investing: Use base rates for industry success/failure, adjust for company-specific factors
  • In Life Choices: Consider historical patterns in career changes, relationships, and personal growth
  • In Decision-Making: Recognize that certainty is rare; work with probabilities rather than absolutes

2. Feedback Loops and Learning

  • Investment Thesis: Set clear markers for success/failure
  • Personal Growth: Regular reflection through journaling and discussion
  • Career Development: Regular check-ins against defined goals and market realities

3. Patience and Compounding

  • Investment Returns: Let time amplify good decisions
  • Personal Development: Build habits and skills systematically
  • Relationships: Invest in long-term connections rather than transactional interactions

4. Authenticity and Conviction

  • Investment Style: Develop and stick to your approach while remaining flexible
  • Personal Brand: Maintain consistency across professional and personal spheres
  • Decision-Making: Trust your analysis while remaining open to new information

Conclusion

Success in any domain – investing, career, relationships – comes from applying these principles consistently over time. The key is recognizing that while the specific applications might differ, the fundamental approaches to decision-making, risk assessment, and long-term thinking remain remarkably consistent.

By understanding base rates, establishing clear feedback loops, maintaining patience, and balancing conviction with flexibility, we can make better decisions across all aspects of life. The goal isn’t to make perfect decisions, but to create a framework that leads to better outcomes over time.

Sources:

Podcasts

Writing

Videos

CIBC – Can I Buy (more) Cheaply?

Introduction

CIBC’s journey from Wall Street wannabe to steady Canadian banking powerhouse is a tale of redemption—and right now, it’s a story of success trading at a premium price. After climbing out of some of the most spectacular financial mishaps in Canadian banking history, the bank has transformed itself. But does its current stock price reflect potential or overvaluation?

It’s been one hell of a good year for CIBC shareholders. As with all Canadian banks, their fiscal year end is October 31*, and results for Q4 and full year 2024 were reported on December 5. This one is one of my biggest positions, from my time when I was particularly focused on dividends. It’s been a good year, and purchases made during the Pandemic period have also panned out quite nicely – see this 5 year stock chart:

Before diving into this year’s results, a brief recap of their history.

Let me see your bulge…bracket

They are Canada’s 5th largest bank by assets and most domestically weighted of the ‘big 5’ notable for its very large residential mortgage portfolio. This wasn’t always the case.

They’ve come a long way since the heady days of the late 1990s and early 2000s, when then-management tried to make it a US Bulge Bracket Bank, competing with the Wall Street firms (i.e. Goldman Sachs, Morgan Stanley, JP Morgan). CIBC was involved in tech IPOs, private equity and arguably tried to be too many things to too many people. There were offices across Europe; they owned investment bank Oppenheimer; executives made the news for buying expensive real estate; CEO succession was fraught and made front page news.

Then the tech bubble popped; the bank was one of many involved in Enron and had one of the largest fines for its role (which still haunted the bank through 2019, having fought with tax authorities about how much of the expense could be deducted against income); the great financial crisis hit, and out went the share price with over $9B in subprime write downs. Leading into that CEO Gerry McCaughey had been appointed around 2005 to stabilize the good ship CIBC, and by 2008-09 many current senior executives had joined at that time from outside the bank, including Merrill Lynch, National Bank, and elsewhere.

As a result of a decade of knocks through 2010, the bank retreated to the foundation that was its Canadian business. Oppenheimer was sold; foreign offices closed or scaled back; and new business was kept to fairly vanilla banking activity. The stock was arguably overlooked by the investing community, and with good reason, having gained a reputation as the bank most likely to step onto a sharp object. That and CEO McCaughey was tasked with keeping things stable, not grow!

This meant the stock traded with a below market PE ratio. See the blue line in the chart below:

Stock Unlock: Free Form Tool, comparing the Big 5 Canadian banks’ PE in the past 10 years.

How does a company work out of a situation like this? Ideally, change the culture and prove it to investors with steadily improving results.

Show me the money!

With McCaughey retiring in 2014 – and how it came about was somewhat emblematic of old CIBC, having renewed his employment contract for three years and then deciding to depart, resulting in a very large payout – succession was brought back to the fore and there were concerns in some corners that the market would see a succession battle like times of old. Somewhat surprisingly, it didn’t happen. Victor Dodig, then head of wealth was appointed by the Board after a search.

In fairly short order, he completed a big round of musical chairs in senior executive ranks. Why? He wanted to ensure that the bank did not find itself in the situation it did when he was appointed. Specifically, he wanted to make sure that there was a “deep bench” of talent that were experts in more areas than a single business line they may have come through. Over his 10 year tenure, this shuffle in the ranks every few years continues, and it seems like results in the business are paying off.

But that skips over the rumbling that started growing a few years into Dodig’s time as CEO. He wasn’t really doing anything. What would be his legacy? What’s the bank’s story? What is CIBC, other than merely Canadian bank? It had been nearly a decade without much to speak of except the problems were past. The other banks can quickly be described – TD and BMO are very American (in different regions); RBC has global aspirations; Scotia is very big in South America.

So what’s a CEO to do? Buy something!

The Purchase of the (21st) century

 In 2017, CIBC completed its record setting purchase of US bank the PrivateBank, based in Chicago. It was known for its customer focused, relationship centric lending practice in the US midwest. The purchase was initially panned after CIBC chased its prize, increasing the purchase price by 20%, in the face of reforms from then-President Trump that resulted in bank asset prices rising.

It was a bold move, that quickly started to pay off, by diversifying the bank, giving it a footprint in the US again outside of capital markets activities and a source of business deposits. Since the acquisition, the bank increased earnings from the US from about 5% at the time of the purchase to over 20% this past fiscal year.

Back to the future! Oh, and Fiscal 2024.

With that brief trip through time, we come back to results this past fiscal year. Handily, their investor fact sheet does the talking quite nicely, so no fancy Stock Unlock charts for this section.

Growth in most metrics have been on a steady uptrend since the 2020 Pandemic year, with some fluctuations owing to losses, particularly in the commercial office portfolio and a ~$1B provision to settle a lawsuit filed by Cerberus in 2015, which hit 2023 results (article). ROE, the common measure of returns for banks, is on an uptrend again after last year, and capital levels are well above OSFI regulated minimums.

Ironically, the Cerberus settlement plus the US regional banking crisis plus US commercial real estate concerns meant market expectations at the end of Fiscal 2023 – a year ago – were pretty low, with some worried it might signal a return to the bank of old and thus didn’t believe the emerging track record of steady results.

In other words, and perhaps with a little benefit of hindsight, the market had over-punished the stock, so with steady and quite positive results in 2024, the potential returns were quite high and indeed, the share price whiplashed back around again. Total shareholder returns were almost 100% in the past year, which for a Canadian bank is absolutely ridiculous.

With the ship righted, a course charted, and engines on full steam ahead, and my nautical references exhausted, the bank has some exciting times ahead of it:

Valuation

This brings us to the question of whether it’s trading at a fair price right now. As usual, I used Stock Unlock to complete my valuation. I used P/E as the valuation metric (10.5 5yr avg), assumed EPS growth on the low end of guidance (7%), and dividend growth slightly below this (5%) as I feel the next two years may pose a challenge to the bank with a significant amount of mortgages up for renewal so management may want to preserve some earnings to build capital to buffer against any losses. I also assume they don’t use their authorized share buyback and so stick with ~1% p.a. average share issuance.

Taken together, the FV is about $73/sh or almost 5% CAGR.

Increasing growth to the high end of 10% gets us to $82/sh or almost 7% CAGR.

If they can keep that growth, I think it’s more likely they would maintain their premium (to their average) PE. Right now the PE is over 13, but I use 12, resulting in a FV of $91.50 and just over 9% CAGR.

Seems like that’s what the market is pricing in, but for me it’s rich at current prices. I like the story, I like the direction, and I like the dividends (up another ~8% this year – a nice raise!), but I’m not going to add to this position right now.

*Perhaps apocryphal, but apparently the banks agreed to do this to help accountants who were otherwise busy from January-April with those whose fiscal year ends matched the calendar (link: https://archive.is/EI4k7)

MSC Industrial – An Industrial Turnaround Play

Business Overview

MSC Industrial Direct (ticker: MSM) is a distributor to light and heavy industrial customers, with a niche in specialty metalworking. They source products and maintain inventory for their customers. These include fasteners, cutting tools, safety equipment, welding supplies, and electrical supplies, among other products. It started as a cutting tool marketer in 1941, Sid Tool, Inc., founded by Sidney Jacobson. It acquired the Manhattan Supply Company in 1970, and then changed the name to MSC Industrial Direct. It IPO’d in 1995.

Customers & Competition

Customers span government, MRO, Fortune 1000 companies and individual machine shops.

Distribution is a very large, and highly fragmented, market. MSC estimates their TAM is $215B, as compared to their 2023 revenues of $4B, and the top 50 distributors represent approx. 1/3 of that market.

In this, there are 19.5MM potential customers and MSC can serve the 750k metalworking customers.

Despite growing at 10%+ CAGR for years, which is greater than their underlying market and means they are gaining market share, they have a small share of the overall market. This is comforting to me insofar as there is a large runway to grow and no dominant player to sweep smaller companies aside.

Notes on Operations

Beyond product distribution, MSC provides inventory management and supply chain solutions, leveraging its “deep expertise from more than 80 years of working with customers across industries.” (2023 annual report).

A significant portion of revenues, 60-70%, come from manufacturing, and about 45% of sales has to do with metalworking This exposes MSC to cyclicality, but this specialization in metalworking is also a differentiator within the broader MRO market.

They guarantee same-day delivery, with 99% of SKUs held in stock. This was unique before the advent of the internet, but still remains a differentiator.

In addition to shipping, they operate on customers’ premises with vending machines and what they call in-plant locations (aka Onsite if one is reading across to Fastenal). They are trying to shift from being a spot buy supplier to a partner, and is earlier on their on-premises journey than Fastenal. It may mean large accounts have greater purchasing power and push down MSC sales prices, but higher volumes and switching costs should come with that shift and mitigate lower prices.

In addition to being a supplier, they provide technical expertise, inventory management, and productivity improvement programs, to capture a greater share of their customers’ overall spend.

They seem to use a mix of owned and leased premises. I prefer owned premises because it gives more optionality and potential hidden value, than a leased one where you are at the whim of a landlord that needs to make a return on their real estate. Specifically, they own five of their 6 fulfilment centres, but lease operational locations. It seems more of a balance, owning what is more critical.

Observations from Investor Days & Recent Developments

Major control block held by founding family

The founding Jacobson/Gershwind family still controls MSC, and the grandson Erik Gershwind is the CEO. His uncle, Mitchell Jacobson, is the former CEO and current non-executive chairman. Erik’s mother, Marjorie, is Mitchell’s sister.

In 2023, they simplified the capital structure by collapsing the class B super-voting shares that the founding family owned. Now, all shareholders own the same class A shares. The founding family’s economic interest is 21%. They also voluntarily agreed to limit their voting to 15% of shares outstanding. Any shares they own in excess of this will be voted pro rata with votes of unaffiliated class A shareholders. Another independent director was added to the board and they completed share repurchases in fiscal 2024 to offset dilution.

Lagging peers in e-commerce solutions

The industry trend is for customers to purchase online – e-commerce, in addition to vending – but MSC has been slow to address this change. As a % of net sales, it’s been flat around 60% since 2017. Management only recently started to address this in 2024, and it’s been a troubled roll out that is thankfully nearing the end. They’ve been upfront about this in analyst calls, and expect the investment to be complete by Q1/25, after which they will launch a marketing campaign to bring awareness to the changes.

Mission Critical

In 2020, they launched the “Mission Critical” program to accelerate market share capture and improve profitability. This includes expanding its metalworking specialist team, expanding solutions (e.g. on premises vending), enhancing e-comm, diversifying customer base and end markets including government and national accounts. The initial phase concluded in 2023 and now they are in what is described as “Phase 2”: maintaining momentum by continuing to invest in what I just described; re-energizing the core customer base (pricing, personalization, cross-selling), and optimizing their cost-to-serve. Long-term targets are:

  1. At least 400bps of growth above market
  2. Incremental margins of 20%
  3. Adjusted operating margin in the mid-teens
  4. ROIC >20%.

Management Review & Compensation

I like the balance between genders on the board. Diversity of thought and experience is important in a fast evolving world.

The CEO, since 2013, is Erik Gershwind, the grandson of the founder. He started with MSC in 2005, working in various roles.

The CFO Kristen Actis-Grande joined in 2020, after nearly 2 decades with Ingersoll Rand, running the finance department for various business lines.

Call out to Martina McIsaac, the president and COO, which is unusual in an American company (usually the  CEO/President/Chairman is wrapped in one role). She joined after a decade with multinational Hilti, ending as region head for N. Am operations, and about 15 years with Avery Dennison. I like that she has international experience, and experience in large organizations.

Interesting that Brian Bello, is interim CIO as of Jun/24. He’s been with the company since 2008 and I think he’s going to be in the hot seat for sorting out the issues with MSC’s e-comm roll out. He has a background as a consultant, which I don’t like, but he does have both computer science and math degrees.

Compensation is a combination of 1) base salary, 2) short-term incentives based on organic revenue, adjusted operating margin, and individual goals, and 3) long-term incentives based on annual average adjusted ROIC, measured over 3 years and cliff vesting after 3 years, or shares vesting over four years (equally).

Their short-term incentives only paid out 55% of bonus targets for 2023. They clearly are paying to retain, but not paying when they don’t perform. I’m ok with this, especially with ROIC being the driver of the cliff-vesting incentives and shares vesting over a longer period.

Financial Review

2024 just wrapped up – their fiscal year end is Aug 31 – and it was a challenging year. MSC’s primary end markets are metalworking and heavy manufacturing, and both sectors had weak demand. Adding to weak demand is the troubled rollout of their new e-commerce platform. This involved significant upgrades in the back and front ends. The issue for MSC, or rather their customers, had to do with pricing and some technical issues.

Sales for the year were impacted by the loss of non-repeating public sector orders (3% of the 8% drop) and lower volumes (5% of the 8% drop) due to weak sector demand. Only 34 of their top 100 customers showed growth.

Vending is a bright spot, flat y/y and representing 17% of net total  sales. Their implant programs were up 5% y/y and these are 16% o total sales. Gross margin outperformed historic seasonality and was up 0.5% y/y, helped by the team’s response to the hampered rollout of e-commerce pricing.

Net debt is low, at 1x EBITDA and <30% of  the balance sheet. Working capital had a favourable impact on cash flow. I was worried if their customers were taking longer to pay and/or inventory was building, but this doesn’t appear to be the case. Cash conversion was 160% for the year, above the 125% target.

I like that they intend to provide a longer-term outlook as the environment in fiscal 2025 stabilizes; for now they are going to stick with quarterly. Right now, it’s not pretty, with the expectation that sales will be down again by ~5%. The US election isn’t helping, because customers are holding off on purchases, but that’s temporary.

The issues are central to management’s focus and it seems this has been fixed, or at least ameliorating, with gross margin increasing in Q4.

Sales weakness has been offset by support from their ‘high-touch’ activities, including sales from vending machines up 9% and in-plant programs up 29%. Despite lower volumes, there are more installations, showing that operating on customers’ premises can be a counter-cyclical source of growth. They also bought back ~2MM shares during the year, or nearly 4% of shares outstanding, but that is really only offsetting the dilution impact of the share simplification last year; nevertheless, it’s a start.

Capital Allocation

MSC started paying a dividend in 2003, and it has regularly increased but the pace of this slowed in recent years. Payout looks high right now, because earnings and FCF took a hit in 2024. It’s still well covered and historic levels are in the range of ~50% FCF and 50-60% of earnings.

Stock Unlock: Dividends data for MSC (retrieved Nov’24)

They also paid special dividends in 2015 and 2020, but after shareholder complaints about it being unreliable this was de-prioritized. The board intends to use this excess capital for a combination of organic growth, share repurchases and tuck-in acquisitions. This makes sense to me, given how fragmented the market is. It is also consistent with their history of M&A e.g. CCSG in 2015, DECO in 2017, AIS in 2018, Buckeye Industrial and Tru-Edge in 2023, and four more in 2024 (Canadian metalworker KAR industrial for $8.3M; Wisconsin metalworker ApTex for $5.6M; Arizona carbide cutting tool manufacturer Premier Tool Grinding for $10.6M; and IP from SMRT to enhance tech capabilities).

After reading investor material and Q&A during their fiscal 2024, I pieced together the following acquisition criteria:

  1. ROIC is the key metric used to evaluate a target. It should generate returns > WACC within 3 years.
  2. The acquisition should enhance market share and add valuable talent.
  3. Accretive to earnings within the first year.
  4. Focus on tuck-in acquisitions, which minimizes integration risks.
  5. Expect to drive synergies to improve margin to MSC levels (cost and/or operational)

Returns on their activities are attractive, hovering in the high teens for over 10 years. I also like their margins for an industrial company. One can see the impact to their margins the destocking after the pandemic and their troubled ecommerce rolling in 2024 have had.

Stock Unlock: Free Form tool showing FCF, ROIC and net margin 2013-2024 (retrieved Nov’24)

Valuation

This isn’t straightforward to value, and there is no guidance of note to work with. I also am not keen on any complicated analysis. Assuming they manage to just get back to previous high earnings of about $350MM p.a. (achieved in 2018 and 2023) with no share count growth and average p/e multiple of 18x gives a ~9% CAGR at current prices over 5 years with a FV of $84/sh*.

Assuming they buy-back ~1% of shares per year brings this to 10% CAGR and a FV of almost $88/sh, and if the issues are fixed, margins increase as they set out to do (20% increase) and multiple expands 10% to 20x, brings this to a 13% CAGR and FV of $101/sh.

*Note that FV is based on a 10% hurdle rate.

Conclusion

I found MSC after a discussion on the Stock Unlock Discord channel, in response to my post on Fastenal. It was suggested that I look into competitors because Fastenal was expensive. WW Grainger is one, which I found both pricey and not at all unique because of how much various product it distributed. I think it opens it for more competition from Amazon business.  While MSC may not be immune to Amazon Business, it is in a niche that requires high grade equipment for metalworking, which I don’t envision a tool shop buying on the cheap.

I also couldn’t believe the market reaction to Fastenal’s Q3 results. They beat expectations by a penny, both revenue and EPS, and the price jumped 10%. It’s even more expensive now. Sometimes, the market doesn’t make sense and I’ll continue to wait that one out.

In the meantime, I find MSC is in an interesting position. They are trading at 2015 prices, but their per share metrics are much higher. There’s a reason for it, they’ve been late to move big into e-commerce vs. Competitors, which they have been called out for and management acknowledged. The Q&A in some of the earnings calls struck me as being transparent about the issues, and what they are doing to address it.

Their business has very strong cash conversion, 100-125%+ of net earnings! Add a well capitalized balance sheet, high ROIC, and a plan to improve, makes this an interesting play. I also believe that long-term re-shoring of manufacturing, especially under a Trump administration, could help here, plus infrastructure investment which will require heavy manufacturing.

My take is that this company is in a turnaround of sorts, with cyclical weak end markets. I decided that I’m not going to buy a stock that I’m not willing to hold at least two years, and this definitely fits that time horizon if not longer.

I don’t expect it will be a smooth earnings recovery in reality, as suggested by the valuation analysis, given that I believe 2025 will be another weak year before some recovery beginning in 2026 and beyond. In the short-term, catalysts I will keep an eye on their comments around completing the website overhaul and the marketing campaign associated with the launch. Then I’ll also watch for any tuck-in M&A that adds to growth. Long-term catalysts to watch for will be how they perform against “Mission Critical” phase 2, and end market activity (heavy industrial, metalworking).

I bought a starting position before Q4 results around $80/sh, results were weak, shares dipped about 5% in response but mostly recovered. I added some more around $79. I couldn’t make heads nor tails of why shares dropped, there wasn’t anything new except perhaps the market didn’t like the downbeat comments on guidance for next year. Maybe? I don’t really know and won’t begin to pretend to be able to predict price movements. Suffice to say I wasn’t surprised by anything in the results.

For this recovery play, I can wait. I’m buying at a 7% FCF and earnings yield around 6%, earning a 4%+ dividend yield with payout well covered by FCF, with management team that has a plan in place, isn’t shy to talk about their challenges, implemented some shareholder friendly changes to their ownership and include long-term metrics in their incentive comp, plus a strong balance sheet and history of FCF generation in all cycles.

I think there is something to it. Or maybe I’m just seeing what I want to see because I want to do something, and I’m merely impatient to wait and buy Fastenal at a cheaper price. After today’s jump in response to the US election, I’m already up 10% on my purchase, but the whole market seemed to like the election result. In reality, this is a slow burn investment and time will tell.

“Never let the future disturb you. You will meet it, if you have to, with the same weapons of reason which today arm you against the present.” —Marcus Aurelius

So with that said, when prices drop below $85 I’ll continue to top up, and will revisit the confidence in my valuation by tracking their performance against their goals as this develops in the next 18-24 months.

CNR – Analysis Retracked

The reference to Retracked means to go over a prior section of rail track to make repairs or adjustments. This post is about me revising prior views.

Since I last wrote about CNR in August, the price has run up about 10% and floated back down to ~$155/sh. I’ve also listened to over three dozen hours of investing podcasts* and read several investing books.

Guy Spier happened to feature in quite a few of these. He runs the Aquamarine fund, which averaged 9% CAGR since inception. A solid, steady return. Not remarkable compared to Buffet or the Nomad Partnership, but it still beats the index and when that annual difference is compounded over decades, it makes a significant positive impact.

Listening to Guy and others, I came upon a concept that is a mix of probability and spirituality. I won’t do the explanation justice, but it’s along the lines of considering our decisions and life on a path of a 1000 possibilities, and making decisions that would result in a positive expected value in the majority of them. Put another way, in the context of investing, one might do really well with leverage – this time. In another possible life, it may ruin us. In a similar vein, always striving for huge returns may work out well, but it may lead us to taking larger risks that lead us to ruin (capital loss). It’s similar to what Annie Duke talks about in her books Quit and Thinking in Bets.

It made me reconsider the somewhat absolute statement I made when I evaluated CNR at a similar price to where it is now. Firstly, I said it wasn’t market beating, so I would avoid it. Specifically, that an 8-12% CAGR was insufficient. Secondly, I wrote the article after reading someone else’s post about CNR not being an attractive investment, clearly biasing my own views in the interest of publishing something provocative. Thirdly, when I calculated my own returns from CNR, I only considered the share price appreciation of ~7.7% CAGR. I didn’t consider the dividends, which add another ~2% to that and bring total returns to nearly 10% CAGR.

I asked myself, knowing what I’ve learned in the past three months, what do I think now? Well, doubling my investment every 7 years? In a business I consider high quality and irreplaceable? That’s nothing to sneeze at. Can’t say I like the increasing leverage, partly to fund those big share buybacks, but I think it was partly in response to the Kansas City acquisition by CP in 2021 to give shareholders a reward of sorts. Even if I would have preferred them not to lever up. Having said that, their leverage target is 2.5x, which they are sitting roughly at now as a result, so it may have been merely taking advantage of spare borrowing capacity supported by their fairly robust underlying business results. It’s something I’m going to keep an eye in any case.

In my prior article, I also thought it was not realistic to assume current multiples would expand back to historic levels. That’s a reasonably safe assumption, insofar as then any expansion is “gravy” if the price one buys at is sufficiently attractive such that returns don’t rely on expansion. That hasn’t changed.

What I didn’t consider, however, was another source of returns: share buybacks. CNR buys about 1-2% of shares annually and reduced its share count by 2.5% CAGR over the past decade.

As I thought more about CNR, I considered the three engines of value: earnings, multiple expansion, and share buybacks. Thanks to John Huber of Saber Capital Management for this framework (link). [Note – I think he misses dividends, so I consider them alongside share buybacks in a ‘shareholder capital return’ bucket].

All this to say, I reconsidered my earlier posture against CNR and have come to the conclusion that at these prices, it is compelling as a solid base to my portfolio. Am I fairly certain about this outcome? Yes. Arguably, I should overweight my investment in it, as compared to a more speculative position.

It’s about positioning to win in the long-term, in the greatest number of possible paths my life might take me.

And why not? This track record (pun intended?) is enviable:

Based on the Q3 guidance for 7% dividend growth, high single digit EPS growth for 3 years, and assuming 1% buyback annually with the P/E unchanged at ~18x presently, the CAGR is 9.5-11.5% based on 6%/8% EPS CAGR. Add a mere 2x increase in the multiple closer to historic average of 20x, we’re looking at 13-15%. The way CNR intends to grow at this GDP+ rate is through own initiatives. These include: i) Expanding at the ports of Vancouver, Prince Rupert, and possibly Montreal, Halifax and St. John, ii) taking advantage of their owned bypass rail around Chicago (speeding up transit times up to 48hrs faster than those who have to go thru the city), iii) introducing automation e.g. Autonomous track inspection cars that run in regular routes, autonomous inspection portals, and handheld tech for field staff, and iv) implementing and sticking to scheduled railroading, which enables them to quickly recover after incidents (like the stoppage due to the fire in Jasper). From the 2023 investor day, as reported in Progressive Railroading (which is not PBR nor focused on making the longest possible trains):

“The way this model works on our railroad is that the plan is created at the center. [It] looks at all the volume across the network and all the parameters,” said CN President and CEO Tracy Robinson during investor day.

Then, a plan is crafted that can optimize the entire network instead of meeting the operating needs of individual yards and facilities. And the plan is the plan — there is no backup or alternative.

I admit it seems contradictory to write a different position on the same stock a mere three months later, but I’ve learned a lot in this intervening period. Plus, the whole point of committing my thoughts to (virtual) paper is to record my thinking process, and that evolution over time. This reminds me of John Maynard Keynes – “When the facts change, I change my mind. What do you do, sir?”

Consequently, I bought some more shares around $154.

* The combination of a long commute and training myself to listen at 2x speed means I can devour audio. Another example of the power of compounding. Try it out.

FAST – Dull done dauntlessly

I first came across this stock in June 2024 and these are my notes after researching them for a few months. I do not yet have a position.

Business Overview

Founded in 1967, IPO in 1987, expanded in Canada in 1994 and Mexico in 2001.

Fastenal (FAST) sells a range of industrial and construction supplies across >8 product lines, through a global network of locations using several forms of technology. These include equipment/parts vending machines, bin stock devices, and e-commerce. Fasteners are the main part of sales at 30-35%. Other parts and safety equipment make up the remainder.

They are primarily B2B, with over 3.4k locations in 25 countries. Supported by distribution centers across N. Am and Europe.  In 2023 they celebrated 20 years in China and 10 years in India.

I like the length of time they have operated, the measured global expansion, B2B focus (higher margins than B2C) and managed distribution network.

I was drawn to 3 key points the CEO emphasized in their 2023 shareholder letter:

  1. Global footprint evolved and generated >$1B revenue for the first time in 2022, and in the Americas alone was $1B in 2023. Global business outside Americas is only $200MM (incl. China and India) and poised to grow.
  2. A large-scale multi-year branch optimization initiative in the US, and lesser degree in Canada, concluded in 2023.
  3. Net cash from operating activities is emphasized as the ultimate determinant of a company’s health.

FAST’s goal is to help customers reduce cost, risk, and growth constraints in their supply chain (reducing total cost of ownership – diagram included below).

Operations

Sales are heavily weighted to industrials, with roughly 40-45% coming from heavy manufacturing and another ~35% from other manufacturing. Non-residential construction, reseller, and other end markets make up the remaining ~25%.

As noted, fasteners are the main source of sales. They are complex to distribute, having a low unit value but high per unit weight, and most suppliers are outside of N. Am. These are bolts, nuts, screws, washers, pins, anchors, etc.

FAST added new products in 1993 and these move through the same distribution channels (discussed below), are purchased by same customers, and use same logistical capabilities as fasteners BUT the supply chain has evolved i.e. these products disproportionately benefit from FAST’s development of industrial vending (also discussed below). The most significant non-fastener sales category are safety supplies, representing about a fifth of sales.

Inventory held at selling locations are almost 2/3rd of inventory, with distribution and manufacturing sites holding the remainder. This allows fast/next-day service at a competitive cost. Only one supplier >5% of purchases, otherwise it’s diversified. Majority of suppliers are in China and Taiwan, and FAST has an incorporated Asian subsidiary to help source supplies on their behalf.

Products are managed via”Fastenal Managed Inventory” (FMI). This is a tool to enhance customer service in both Branches and Onsite:

  • Bin stock (FASTStock / FASTBin) – product held in bins in a customer facility. Similar to vending business. FASTBin is the evolution of FASTStock into a set of electronic inventory management solutions and automate processes (24/7 monitoring, visibility and replenishment) via weight sensors, infrared quantity values, and RFID for notifications to refill orders when bins moved to restrock zone.
  • Industrial vending (FASTVend) introduced in 2008 provided reduced product handling, Pos, consumption and 24/7 availability. Currently have 112k devices in field and FAST estimates the market could support 1.7MM vending units before saturation hit. Target revenue is under $1k to over $3k per unit per month. Flagship model, FAST 5000 has a targeted throughput of $2k monthly.

FMI hit 40% of sales in 2023. Since Q1/21, a weighted FMI measure reported that combines signings of FASTBin and FASTVend in ‘machine equivalent unit’ (MEU) based on expected output of each device. FastStock is not standardized, and so not reported. Conversion is in comparison to Fast5000 target throughput.

E.g. RFID enclosure with $2k monthly target is 1 ($2000/$2000). An IR bin with target monthly revenue of $40 is 0.02 ($40/$2000). Not necessary to understand the business but it helps to see how management track operations. Despite weak industrial activity, this is growing well so far this year (from 2Q24 press release):

Digital solutions are also provided to deliver value e.g. e-commerce platforms, digital visibility through an app, and analytics (‘FAST360’). E-commerce is a large part of sales, both for new business and to support customer preferences.

FAST operates 15 regional distribution centers in N. Am – 12 in US, 2 in Can, 1 in MX, and a further 2 in EU to permit deliveries 2-5 times weekly in market using owned trucks and overnight delivery by common carriers. Roughly 75% of N.Am in-market locations receive service 4-5x week.

Of these, 11 N.Am centers are operated with automated storage and retrieval systems, and handle >90% of picking activity. Plans in place to automate others, expand and/or add new locations.

Transport ~90% of own products using their own fleet of Class 6, 7 and 8 trucks, and the rest is 3rd party shippers. These are commercial vans up to 18 wheelers (link). Costs show up in COGS and fluctuations usually addressed by adding freight charges to customer purchases. ~520 trucks are leased for this purpose. Delivery in-market is a mix of leased and owned vehicles totaling over 10k units.

FAST differentiates itself from competitors by offering multiple sales channels in proximity to customers (if not on their premises). Potentially the largest, best capitalized competitor is Amazon B2B, but as yet hasn’t turned its sights on FAST’s area of focus, nor do I think it would be easy for them to deliver the level of customer service or convenience that FAST does.

Branching Out

The Company started with a Branch network and expanding this was the primary source of growth, until 2013. Management determined they were saturated with branches and focused on their Onsite locations, which are within or proximate to customers’ locations, and in 2015 they started to reduce the number of Branches to optimize operations.

At peak branch coverage, they were 30min drive of 95% of US manufacturing. As of 2024 they have 1,441 branches and still 30-min within 93.5% of marketplace. The benefit of the shift to Onsite is reduced occupancy costs, but a nearly 10-year initiative was a distraction for management, since concluded.

Network coverage is huge: ~52% of sales and revenue came from major metropolitan statistical areas (MSAs) (pop’n >500k), another ~20% from small MSAs (<500k), and ~30% not in an MSA.

The Onsite advantage

Started in 1992 and emphasized since 2015. Onsite has 3 main variations, latter two types usually due to customer’s lack of space.

  1. Dedicated business unit with people and inventory in a customer’s facility
  2. Dedicated business unit with people and inventory primarily placed in a facility located near customer site, or
  3. Dedicated business unit primarily located in the back of an existing FAST branch.

CEO claims network “unlocks [FAST] energy to pursue”, freeing up time to greater engage with customers, be curious, provide the right products tailored to a customer’s needs and do it in a cost-effective way.

Example: four oldest markets are Minnesota, Wisconsin, Iowa, Illinois, about 19% of revenue in 2007. Between 2007-2017, revenue and EBT grew at a CAGR of 5.7% and 5.6%, respectively. Between 2017-23 CAGR was 8.2% and 8.5% respectively, and represented 15% of revenue.

Put another way, despite Branch locations in these 4 states decreasing 30%, with Onsite locations up by a factor of 7x, FAST was able to provide local presence and tailored service, enhancing growth in mature markets at a lower cost!

Tradeoffs do exist for Onsite vs. Branch: best suited for large customers; sales mix tends to produce lower gross profit than branches, but more revenue from the customer is gained and cost to serve is lower. Total site locations were flat through 2021 as Branch closures were offset by Onsite openings, and since then total number of locations is higher than before with continued growth Onsite. This is expected to continue, as management have identified over 12k locations in N. Am to deploy Onsite, for both existing and new customers.

Stock Unlock: KPI for Fastenal, Branch Locations / Onsite Locations / Total locations 2019-2Q24 (retrieved Sep’24)

Management Review

Low share based compensation, around 0.5% of cash flow. Since the IPO, they maintained a philosophy of minimizing the impact of dilution and have grown primarily using internal cash flow.

Started this year’s Q2 call with a story about how they check in with staff in Texas, or Florida, ahead of hurricanes, to check in and assure them they have the support of management. This means that a decision made amidst chaos in the middle of the night, that someone else may try to pick apart with the benefit of hindsight, will not be something done at FAST. As long as customers and employees are taken care of, management will support them. They are also encouraged to take care of their communities e.g. a nearby hospital or retirement home without power, check in on them too. Help them, because that’s the type of company FAST is. They are a supply chain when people need help.

Also didn’t shy away from the challenges YTD. Upfront about them in their prepared remarks. Also acknowledged mistakes from 2021 and 2022 about misalignment across the enterprise, and how it’s a 23,000 person team.

Management cite that FAST’s success is owing to high quality, long-tenured employees; proximity to customers; ability to reduce customers’ total cost of owning inventory and procurement (‘TCO’) through this product and service offering:

Listen to the 2Q24 call or read the CEO letter in the 2023 annual report to see for yourself.

Financial Review

Revenue fluctuates but growing annually and has an impressive track record with 2009 seeming to be the only decrease in the past 30 years. Very strong cash conversion, nearly 100% of net income. This is a metric management highlight in earnings releases.

FCF jumped after the Pandemic with activity ramping up, hitting a peak of about $1.2B and is pulling back slightly since then. Partly due to weaker end markets and higher capex for FMI, facility construction and upgrades, and vehicle spending.

2Q24 earnings call mentioned sluggish industrial demand, negative pricing trends for both fasteners and non-fastener products, layoffs and shift reductions.  Despite this they grew their lower cost e-business by 25% (digital is now ~60% of total business), onsite and FMI installs driving national account by low double digits.

With the transition from Branch to Onsite, they lost some margin but became more entrenched with customers. With the Branch realignment complete, we see margins have stabilized:

Stock Unlock: Financial Metrics for FAST (retrieved Sep’24)

As I noted above, 75% of revenue comes from industrial sources. Long term tailwind with the IIJA and IRA, but right now (as mentioned re: CNR), prolonged sub-50 ISM for 19 of the past 20 months (almost 2 years!).

Prudently managing the balance sheet and reducing debt. This is a direct response to the current environment. Their debt is comprised of unsecured promissory notes at fixed rates (sub 3%), and can borrow up to $900M under the program. Modest amounts due between 2025-2030. Liquidity provided by $250M cash and an undrawn $835M revolver.

Investing to develop financial tools in the past 3-5 years to help field staff make informed pricing decisions, which is being emphasised for Q3. Launched an internal AI tool for operational use.

Their customers seek cost reductions. Using their value proposition and cost saving solutions (onsite) to grow national account signings and transaction w/ FMI.

Nevertheless, they’ve been able to adapt while keeping returns high. ROIC increased from 23% in 2010 to 34% as of 2023.

Capital Allocation

Historically, growth has been through reinvesting cash flow rather than acquisitions. They will occasionally buy back stock. Last time was ~$220MM in 2022. Looking at share price chart, this was a shrewd decision (5MM shares at an average price of $47.58).

Minimal debt. Almost net cash position. Debt balance around $300-400MM since 2015, ticked up to ~$550MM in 2022 and is now below historic levels sitting around $250MM.

Dividends are part of their total returns but not significantly so. Last year marked the fourth year in their public history that they paid out a special dividend, with the first one being Dec’08 (!!); at that time they felt the cash was their shareholders, they had too much and didn’t know if shareholders had liquidity needs and knew they had more than needed to get through 2009, so they returned it. The other times were in 2012 and 2020. The yield is <3%, but it has boosted total returns:

Stock Unlock: Dividends info for FAST (retrieved Sep’24)

Valuation

Analysts forward estimate

Fwd EPS estimate is a mean of $2.08 for 2024, $69.21 sh price as of Sep 11th means P/E = 33.27x for 2024. With a LTM 2Q24 diluted EPS $2.01, for a P/E of 34.4, so slightly overvalued compared to estimates.

My Basic DCF

Earnings are the most stable indicator for FAST, and so used for my valuation. A lot of the growth in the past 10 years was a result of shifting from own stores (closing down, saving costs), and moving to on customer premises. Led to net income growth of 9.6% CAGR, which accounts for most of the share price return. P/E CAGR was only 1.1% over the past 10 years.

Assuming that earnings growth continues at the current p/e multiple of 33x, it’s just under fair value of $72. That doesn’t leave much of a margin of safety, considering issues noted in the Financial Review. Especially since I think some of the ‘easy’ gains from closing Branch stores have been realized, and now it’s Onsite locations driving growth.

Adjusting inputs to assume slower growth of 7% CAGR for the next 5 years, being some cost savings above 5-6% topline growth, no buybacks (they only do it opportunistically), dividend growth per average, and average p/e of 30x, the FV is $58. If I assume a premium multiple of 33x, the FV is $64. These FV assume a 10% hurdle return and based on LTM 2Q24 earnings of $1,152M.

All this makes me think it is overpriced. So I looked back in time and the last time it was trading around $65 (it’s trading a few bucks higher now) was at the end of 2021. Comparisons are quite telling, they are definitely growing into those lofty expectations:

YE212Q24 LTM
P/E (x)39.831.2
P/FCF (x)6031.4
ROIC (%)29.333.2 (only breached 30% since 2022)
FCF/sh ($)12
FCF ($M)6141,146
OCF ($M)7701,336

Conclusion

I think this is a very well run company, a solid business with sustainably high cash conversion and improving returns. Clearly the shift from Branch to Onsite locations is bearing fruit, and even though it took a decade to complete, management was willing to take the long-view. Based on management’s comments, I believe they value the six key stakeholders: customers, suppliers, employees, owners, the regulators, and the community. They don’t shy away from discussing challenges.

I think this is a company that has earned a premium multiple, and as much as I want to buy shares right now, I feel there may be better entry point, even comparing the improved valuation now versus YE21.

I think the share price is still a little high considering the weak industrial demand. Shares dropped from mid-$70s following the Q2 results, and looking at monthly sales reports published on their website, I don’t think Q3 will be stellar. The whole market is up as of early September and I think that’s what is keeping shares buoyed.

I’ve debated buying some shares now and averaging down, but it’s a toss up. The comparison to 2021 shows they are a larger company now and more worth the current price, and I could argue deserve a premium, but I can’t ignore the sector headwinds. I think the price is ignoring those. Since they report in early October, I’ll reassess and make a decision then.

BCE – Bloated Corporate Enterprise

Overview

With some interest in dividend circles over BCE’s seemingly juicy dividend yield of 8.2% (as of Sep 5/24), I decided to review my thoughts nearly a year on from selling this former core part of my portfolio. I first bought BCE in January 2015 for $53. I sold it in November 2023, almost 9 years later for…drum roll, please…$53.85. Including dividends, my CAGR was a measly 2.7%. According to the Bank of Canada, inflation also averaged 2.7% over this period, so I earned 0% in real terms. So much for safe.

Setting the Context

BCE has long been a favourite for income investors, with a steady yield and growing dividend. It’s why I originally bought it, when I was looking for good, safe, dividends. Which it certainly paid out, but really only ever done that:

Stock Unlock dividends snapshot for BCE, showing growth and yield for the 10 years through Sep'24.

Stock Unlock: Dividends for BCE 2014-2024/09/04 (pulled Sep’24)

BCE did provide a stable yield, but this came with very low price growth (<5% CAGR) and frankly sub-par returns. I recognize that I say this with the benefit of hindsight. With my value lens now, would I have done differently? I wish I could say I would have sold around $70, but I really don’t know.

Peering into the Behemoth that is BCE

It was an exciting time in the late 2010s. Operations were generating ROIC around 15%, wireless subscriber count was rising, Samsung and Apple constantly rolled out phones, FCF was ticking up and all seemed well in hand. Bell even managed to close the acquisition of MTS in early 2017, and started embarking on a huge build out of a national fiber optic network to leapfrog Telus and Rogers by providing fiber-to-the-home and a backbone of the new national 5G wireless network.

All this cost money, and a lot of it. Looking over my notes, I picked up on cracks in 2021, after reading that they spent a whopping $7B on capex. Coupled with a portion of their legacy high margin business starting to run off, competition with Telus and Rogers, something had to give. They simply weren’t growing and more than doubled their debt pile since 2010:

Stock Unlock: Summary income statement elements for BCE, annual, 2017-2023

Stock Unlock: Financials for BCE, summary income statement 2017-2023 (pulled Sep’24)

Stock Unlock Free Form screenshot for BCE, showing Share Price, FCF, ROIC and Total Debt 2010-2024/09/06 (pulled Sep'24)

Stock Unlock: Free Form for BCE, Share Price, FCF, ROIC and Total Debt 2010-2024/09/06 (pulled Sep’24)

With the share price tumbling, a growing debt pile, anemic growth, and noise over regulation, I decided to pull the trigger and sell out in the Autumn of 2023. It was a difficult decision for a formerly income-focused investor. The fundamental part of me couldn’t rationalize holding it any longer though, especially once it reached the point that they could no longer generate FCF to cover their dividends. That set off alarm bells.

It’s Not Me Darling; It’s You.

My unease wasn’t something I woke up with, but something that grew since about 2020. Management struck me less as stewards of their shareholders’ capital and more interested in their own rewards. They chose to continue to raise the dividend, which wasn’t necessary, instead of taking a harder decision to preserve the company for a long-term benefit. I read that 2023 marked 16th consecutive year of dividend growth. Sounds good, until one realizes that by year-end 2023 they needed to borrow to pay dividends to the tune of at least $600M per year, rising to $900M based on LTM Q2/24. As a result, BCE is creaking under the weight of its debt and recently had its credit rating downgraded to one level above ‘junk’ status.

Management also blamed government regulation for the decision to cut back on investment by $1B over 2024-25. Specifically, they cited having to grant access to their network to wholesalers in Ontario and Quebec. These players may present competition and BCE does not want that. It may be true, but I also think their excuse is disingenuous, and that pointing to regulation was a smokescreen. Using it as a convenient excuse, it enabled them to save face and not have to take accountability for their investment decisions and poor results. As an aside, there is a reason why the UK forced British Telecom to separate the network infrastructure from the retail/service part of the business, into a legally separate entity called Open Reach (link).

These are only two examples of management actions that I disliked (I realize the capex cut came after my sale, but it was being considered ahead of that while I was still a shareholder). Two more examples are:

  1. Taking advantage of corporate welfare to avail itself of some ~$150M of COVID-era funds from the Government of Canada in 2020. BCE did not need this given it’s (then) sufficient FCF, access to the debt capital markets, and drawing over $1B on its revolver during 2020 as a cash backup which it subsequently repaid. Management even admitted, in the public furore that followed the revelation of large Canadian companies taking advantage of CEWS, that the amount of money was immaterial.
  2. Corporate decisions that ran fiber to the CEO’s cottage, while leaving other year-round residents lacking (link).

Of course I don’t believe the CEO is responsible for making every decision, but they are certainly responsible for decisions made in the enterprise. The sum of these actions suggest a corporate culture that I don’t agree with and turned me off the management team.

“In the Long Run, the Market is a Weighing Machine”

It’s fair if one wanted to leave qualitative assessments aside, and look at some numbers instead. I already pointed out above that growth stalled, debt grew, and was further exacerbated by having to borrow more to pay the dividend. Operations were also generating worse returns over this time:

Stock Unlock: Financials/Metrics for BCE (2013-2023)

Taken together, they had underwhelming stock market performance, even well before the Pandemic. This merely continued post-Pandemic, once the euphoria wore off:

Stock Unlock: Returns detail for BCE (2014-Sep’24)

Concluding Remarks / Actions

I don’t think they will go under, but I think it will take years to clean up their capital stack. All the while I don’t expect their stock price will do much, there won’t be as much cash to invest in the business, employees and customers may suffer (even more) cost cutting efforts, and dividends being cut is a very real possibility.

Clearly, there are much better places to put one’s money, whether for income or for growth. This review confirms my decision to get out of this position. I merely wish I had started writing my thesis for each investment sooner (hence part of this blog reviewing each position I have). Had I done this, I’d like to think I would have been in a better position to decide to sell sooner, perhaps with a modest gain. Perhaps not. I haven’t really lost money, just the time this investment could be put elsewhere.

The lesson here I suppose isn’t necessarily that dividend investing is bad, but not having a reason to invest in a company beyond income isn’t inherently prudent, and there is an opportunity cost. I would have done better with almost any other of my investments over this time period.

CNR – Smoke but no fire, still overvalued

My first post! I haven’t yet set a standard template for company analysis, but I intend to do so to help keep things organized. I will also include charts to help convey what I am evaluating. I plan on starting my blog by reviewing my holdings in a series of posts.

Overview

I’ve held CNR since July 2015. It’s done fairly well for me in terms of dividend growth (11.7% CAGR) but less stellar in terms of share price appreciation (approx 7.6% CAGR). I’m now trying to view my investments with a value lens and with news of a strike on the horizon earlier this year, I thought it might be a buying opportunity. Shares have come off the their earlier highs of ~$178/sh to trade around $155/sh, down about 15%. I like CNR as a company with its wide moat – those railroads aren’t going to be replicated – and decent operating returns (+/- 15% ROIC) and, in my view, a safe dividend payer (FCF dividend payout around 50-60%). I almost added to my position this year with that view in mind but tried to put a valuation lens on it and passed. My conclusion is that I don’t think the share price is low enough .

In the short-term, while I’m worried about the strike of course, I don’t think it will be a drawn out issue considering the significant of labour disruption on the supply chain. There may even be legislative solutions implemented when the Feds return to the Fall session, if it comes to it. I won’t ruminate on what might happen if the strike runs a long time. In itself, it was already a known factor. This is how I came to my conclusion and decided to pass on adding more at the moment.

Setting the Context

What I saw was that the share price run up in 2024 came mainly from multiple expansion (both P/E, P/OCF). The underlying performance was pretty stable; $6.8-7B OCF and $5-5.5B earnings. I’m giving a range because I’m scanning TTM metrics over a few quarters.

Going back 5 years, the CAGR is about 4% for earnings and 2% for OCF. Neither are stellar, but shouldn’t be surprising, because it’s a railroad that is the backbone of the economy, not a tech growth stock.

As of late August, both multiples are sitting around the median: 18x actual PE vs. 20.7x median and 14.3x actual P/OCF vs. 15.5x median. Yes, perhaps a little cheap by historical standards but not much of a discount.

Freeform analysis of CNR over the past 5 years through August 2024, on Stock Unlock. Showing OCF, FCF, share price, P/OCF, P/FCF and P/E.

Stock Unlock: Free Form tool for CNR

This is a good candidate to value based on FCF since its fairly steady despite $2.5-4B of investments per year. The story is the same in terms where the multiples sit. In the past 5 years FCF has grown at a good clip of 12% p.a., but stock price has only moved at ~4% CAGR, so P/FCF has shrunk by 6% p.a. (!!). Maybe there is an argument for multiple expansion? The 27.5x P/FCF multiple is a bit below 30x median and still high off the 22x low from last year. Unfortunately, FCF itself is also trending down, due to a double whammy of higher capex and lower OCF.

A lot of their cargo is commodity based and at the moment, on a quarterly basis it seems to have flatlined (pet chems, metals/minerals,  grain and fertilizers, coal, freight and automotive). Some very slight growth in intermodal and forest products:+

KPI for CNR, showing quarterly revenue by product from 2019 through 2Q24.

Stock Unlock: KPI for CNR as of 2Q24 (pulled Aug’24).

I don’t see the underlying part of the multiples growing at the moment. Especially not with my concerns over the consumer. By which I mean too much mortgage, car and credit card debt that will dampen demand now that excess Covid-era savings have been used up. Industrial activity is fairly anemic too, according to declining Purchasing Manager Indices in both Canada and US; I still think the IRA in the US will provide a secular tailwind but at the moment the investment isn’t yet happening in a big way. CNR even mentioned on their July Q2 earnings call both softness domestically and oversupply of truck capacity leading to lower revenue per track mile, with further expected challenges due to the then-anticipated strike.

Valuation

Using the DCF calculator on Stock Unlock, and if I merely assume historic performance over the next 5 years (growth and average price ratios), we get 8% CAGR and a FV of ~$145/sh on a OCF basis and almost 13% CAGR on an earnings basis with a FV of ~$178/sh. If we believe guidance of mid-to-high single digit earnings growth, say 7.5%, then share price CAGR is nearly 16%…if they can sustain that for the next 5 years and P/E ratio expands back to the 5 year average of 21.9x from 18x currently.

Then it starts to look really attractive on a FCF basis assuming historic growth rates, with a FV of almost $230/sh and nearly 19% CAGR. I don’t believe it, though. Capex has run up about 6% p.a. since the Pandemic and see my comments above about demand. Multiples also have to expand, and recently, OCF has tumbled a bit. Part of the longer historic price run up was the company’s move to precision based railroading (PBR), and more recently since 2020/Pandemic, pent up demand driving volumes and helping push up all results.

Arguably CNR moved away from the intensity of PBR in recent years and could do a bit more to eke out better margins, driving up OCF and earnings, but I don’t think there is a lot of excess cost to trim without sacrificing operations and safety. Searching online already reveals many news articles about those issues; indeed that’s part of what the strike is about.

Concluding Remarks / Actions

CNR doesn’t fit my value-objective at these prices because I don’t think it’s compellingly cheap. Reasonably priced? Yes, probably, but not market beating. Conversely, I don’t think it’s significantly overpriced so I won’t sell my main holding for now. I have a small position in a side account and will swap that for BN.

×