I first came across this stock in June 2024 and these are my notes after researching them for a few months. I do not yet have a position.
Business Overview
Founded in 1967, IPO in 1987, expanded in Canada in 1994 and Mexico in 2001.
Fastenal (FAST) sells a range of industrial and construction supplies across >8 product lines, through a global network of locations using several forms of technology. These include equipment/parts vending machines, bin stock devices, and e-commerce. Fasteners are the main part of sales at 30-35%. Other parts and safety equipment make up the remainder.
They are primarily B2B, with over 3.4k locations in 25 countries. Supported by distribution centers across N. Am and Europe. In 2023 they celebrated 20 years in China and 10 years in India.
I like the length of time they have operated, the measured global expansion, B2B focus (higher margins than B2C) and managed distribution network.
I was drawn to 3 key points the CEO emphasized in their 2023 shareholder letter:
- Global footprint evolved and generated >$1B revenue for the first time in 2022, and in the Americas alone was $1B in 2023. Global business outside Americas is only $200MM (incl. China and India) and poised to grow.
- A large-scale multi-year branch optimization initiative in the US, and lesser degree in Canada, concluded in 2023.
- Net cash from operating activities is emphasized as the ultimate determinant of a company’s health.
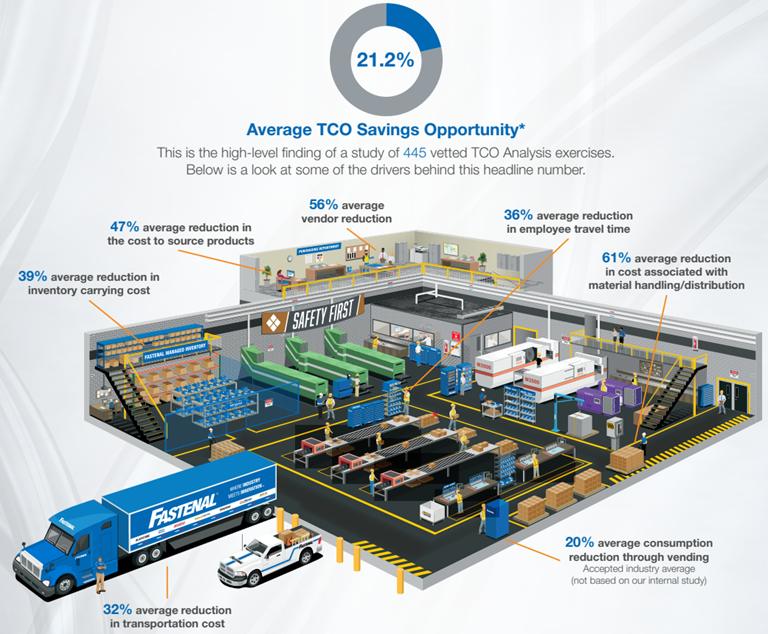
FAST’s goal is to help customers reduce cost, risk, and growth constraints in their supply chain (reducing total cost of ownership – diagram included below).
Operations
Sales are heavily weighted to industrials, with roughly 40-45% coming from heavy manufacturing and another ~35% from other manufacturing. Non-residential construction, reseller, and other end markets make up the remaining ~25%.
As noted, fasteners are the main source of sales. They are complex to distribute, having a low unit value but high per unit weight, and most suppliers are outside of N. Am. These are bolts, nuts, screws, washers, pins, anchors, etc.
FAST added new products in 1993 and these move through the same distribution channels (discussed below), are purchased by same customers, and use same logistical capabilities as fasteners BUT the supply chain has evolved i.e. these products disproportionately benefit from FAST’s development of industrial vending (also discussed below). The most significant non-fastener sales category are safety supplies, representing about a fifth of sales.
Inventory held at selling locations are almost 2/3rd of inventory, with distribution and manufacturing sites holding the remainder. This allows fast/next-day service at a competitive cost. Only one supplier >5% of purchases, otherwise it’s diversified. Majority of suppliers are in China and Taiwan, and FAST has an incorporated Asian subsidiary to help source supplies on their behalf.
Products are managed via”Fastenal Managed Inventory” (FMI). This is a tool to enhance customer service in both Branches and Onsite:
- Bin stock (FASTStock / FASTBin) – product held in bins in a customer facility. Similar to vending business. FASTBin is the evolution of FASTStock into a set of electronic inventory management solutions and automate processes (24/7 monitoring, visibility and replenishment) via weight sensors, infrared quantity values, and RFID for notifications to refill orders when bins moved to restrock zone.
- Industrial vending (FASTVend) introduced in 2008 provided reduced product handling, Pos, consumption and 24/7 availability. Currently have 112k devices in field and FAST estimates the market could support 1.7MM vending units before saturation hit. Target revenue is under $1k to over $3k per unit per month. Flagship model, FAST 5000 has a targeted throughput of $2k monthly.
FMI hit 40% of sales in 2023. Since Q1/21, a weighted FMI measure reported that combines signings of FASTBin and FASTVend in ‘machine equivalent unit’ (MEU) based on expected output of each device. FastStock is not standardized, and so not reported. Conversion is in comparison to Fast5000 target throughput.
E.g. RFID enclosure with $2k monthly target is 1 ($2000/$2000). An IR bin with target monthly revenue of $40 is 0.02 ($40/$2000). Not necessary to understand the business but it helps to see how management track operations. Despite weak industrial activity, this is growing well so far this year (from 2Q24 press release):
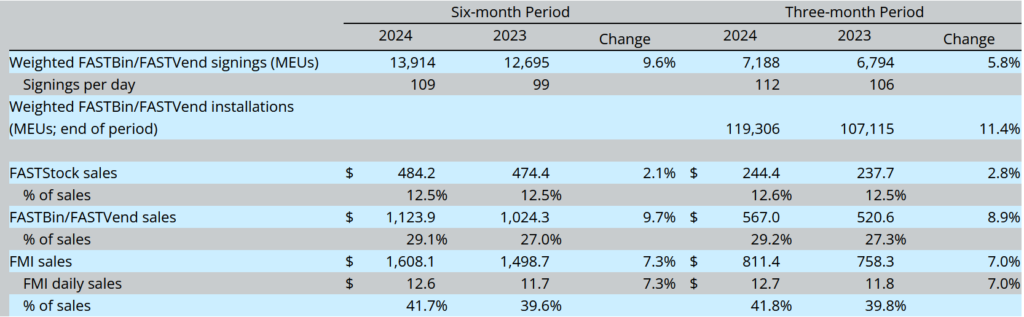
Digital solutions are also provided to deliver value e.g. e-commerce platforms, digital visibility through an app, and analytics (‘FAST360’). E-commerce is a large part of sales, both for new business and to support customer preferences.
FAST operates 15 regional distribution centers in N. Am – 12 in US, 2 in Can, 1 in MX, and a further 2 in EU to permit deliveries 2-5 times weekly in market using owned trucks and overnight delivery by common carriers. Roughly 75% of N.Am in-market locations receive service 4-5x week.
Of these, 11 N.Am centers are operated with automated storage and retrieval systems, and handle >90% of picking activity. Plans in place to automate others, expand and/or add new locations.
Transport ~90% of own products using their own fleet of Class 6, 7 and 8 trucks, and the rest is 3rd party shippers. These are commercial vans up to 18 wheelers (link). Costs show up in COGS and fluctuations usually addressed by adding freight charges to customer purchases. ~520 trucks are leased for this purpose. Delivery in-market is a mix of leased and owned vehicles totaling over 10k units.
FAST differentiates itself from competitors by offering multiple sales channels in proximity to customers (if not on their premises). Potentially the largest, best capitalized competitor is Amazon B2B, but as yet hasn’t turned its sights on FAST’s area of focus, nor do I think it would be easy for them to deliver the level of customer service or convenience that FAST does.
Branching Out
The Company started with a Branch network and expanding this was the primary source of growth, until 2013. Management determined they were saturated with branches and focused on their Onsite locations, which are within or proximate to customers’ locations, and in 2015 they started to reduce the number of Branches to optimize operations.
At peak branch coverage, they were 30min drive of 95% of US manufacturing. As of 2024 they have 1,441 branches and still 30-min within 93.5% of marketplace. The benefit of the shift to Onsite is reduced occupancy costs, but a nearly 10-year initiative was a distraction for management, since concluded.
Network coverage is huge: ~52% of sales and revenue came from major metropolitan statistical areas (MSAs) (pop’n >500k), another ~20% from small MSAs (<500k), and ~30% not in an MSA.
The Onsite advantage
Started in 1992 and emphasized since 2015. Onsite has 3 main variations, latter two types usually due to customer’s lack of space.
- Dedicated business unit with people and inventory in a customer’s facility
- Dedicated business unit with people and inventory primarily placed in a facility located near customer site, or
- Dedicated business unit primarily located in the back of an existing FAST branch.
CEO claims network “unlocks [FAST] energy to pursue”, freeing up time to greater engage with customers, be curious, provide the right products tailored to a customer’s needs and do it in a cost-effective way.
Example: four oldest markets are Minnesota, Wisconsin, Iowa, Illinois, about 19% of revenue in 2007. Between 2007-2017, revenue and EBT grew at a CAGR of 5.7% and 5.6%, respectively. Between 2017-23 CAGR was 8.2% and 8.5% respectively, and represented 15% of revenue.
Put another way, despite Branch locations in these 4 states decreasing 30%, with Onsite locations up by a factor of 7x, FAST was able to provide local presence and tailored service, enhancing growth in mature markets at a lower cost!
Tradeoffs do exist for Onsite vs. Branch: best suited for large customers; sales mix tends to produce lower gross profit than branches, but more revenue from the customer is gained and cost to serve is lower. Total site locations were flat through 2021 as Branch closures were offset by Onsite openings, and since then total number of locations is higher than before with continued growth Onsite. This is expected to continue, as management have identified over 12k locations in N. Am to deploy Onsite, for both existing and new customers.
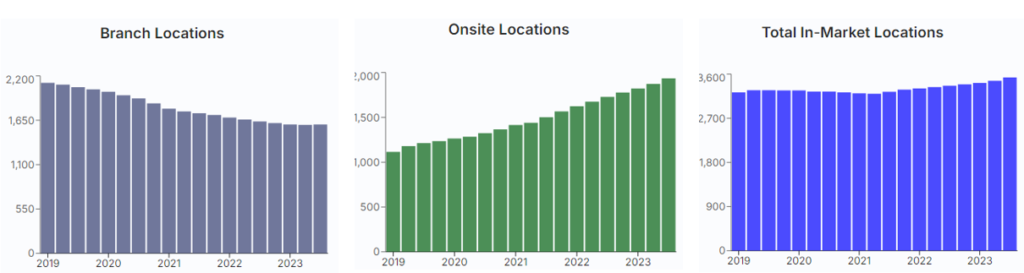
Stock Unlock: KPI for Fastenal, Branch Locations / Onsite Locations / Total locations 2019-2Q24 (retrieved Sep’24)
Management Review
Low share based compensation, around 0.5% of cash flow. Since the IPO, they maintained a philosophy of minimizing the impact of dilution and have grown primarily using internal cash flow.
Started this year’s Q2 call with a story about how they check in with staff in Texas, or Florida, ahead of hurricanes, to check in and assure them they have the support of management. This means that a decision made amidst chaos in the middle of the night, that someone else may try to pick apart with the benefit of hindsight, will not be something done at FAST. As long as customers and employees are taken care of, management will support them. They are also encouraged to take care of their communities e.g. a nearby hospital or retirement home without power, check in on them too. Help them, because that’s the type of company FAST is. They are a supply chain when people need help.
Also didn’t shy away from the challenges YTD. Upfront about them in their prepared remarks. Also acknowledged mistakes from 2021 and 2022 about misalignment across the enterprise, and how it’s a 23,000 person team.
Management cite that FAST’s success is owing to high quality, long-tenured employees; proximity to customers; ability to reduce customers’ total cost of owning inventory and procurement (‘TCO’) through this product and service offering:
Listen to the 2Q24 call or read the CEO letter in the 2023 annual report to see for yourself.
Financial Review
Revenue fluctuates but growing annually and has an impressive track record with 2009 seeming to be the only decrease in the past 30 years. Very strong cash conversion, nearly 100% of net income. This is a metric management highlight in earnings releases.
FCF jumped after the Pandemic with activity ramping up, hitting a peak of about $1.2B and is pulling back slightly since then. Partly due to weaker end markets and higher capex for FMI, facility construction and upgrades, and vehicle spending.
2Q24 earnings call mentioned sluggish industrial demand, negative pricing trends for both fasteners and non-fastener products, layoffs and shift reductions. Despite this they grew their lower cost e-business by 25% (digital is now ~60% of total business), onsite and FMI installs driving national account by low double digits.
With the transition from Branch to Onsite, they lost some margin but became more entrenched with customers. With the Branch realignment complete, we see margins have stabilized:
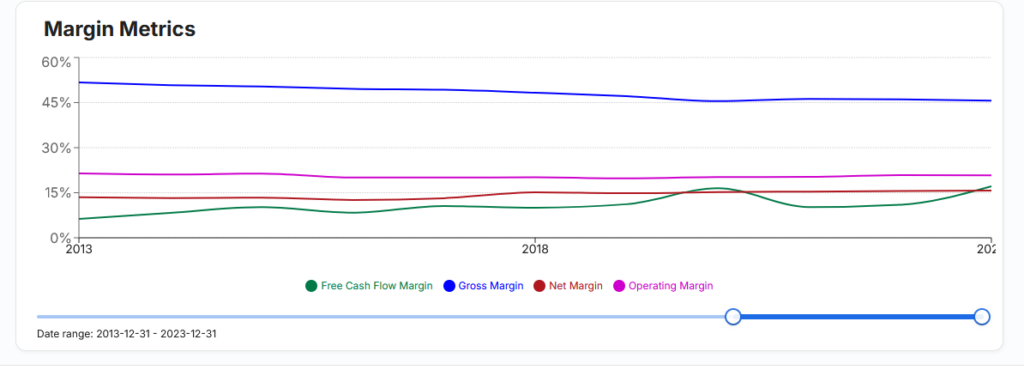
Stock Unlock: Financial Metrics for FAST (retrieved Sep’24)
As I noted above, 75% of revenue comes from industrial sources. Long term tailwind with the IIJA and IRA, but right now (as mentioned re: CNR), prolonged sub-50 ISM for 19 of the past 20 months (almost 2 years!).
Prudently managing the balance sheet and reducing debt. This is a direct response to the current environment. Their debt is comprised of unsecured promissory notes at fixed rates (sub 3%), and can borrow up to $900M under the program. Modest amounts due between 2025-2030. Liquidity provided by $250M cash and an undrawn $835M revolver.
Investing to develop financial tools in the past 3-5 years to help field staff make informed pricing decisions, which is being emphasised for Q3. Launched an internal AI tool for operational use.
Their customers seek cost reductions. Using their value proposition and cost saving solutions (onsite) to grow national account signings and transaction w/ FMI.
Nevertheless, they’ve been able to adapt while keeping returns high. ROIC increased from 23% in 2010 to 34% as of 2023.
Capital Allocation
Historically, growth has been through reinvesting cash flow rather than acquisitions. They will occasionally buy back stock. Last time was ~$220MM in 2022. Looking at share price chart, this was a shrewd decision (5MM shares at an average price of $47.58).
Minimal debt. Almost net cash position. Debt balance around $300-400MM since 2015, ticked up to ~$550MM in 2022 and is now below historic levels sitting around $250MM.
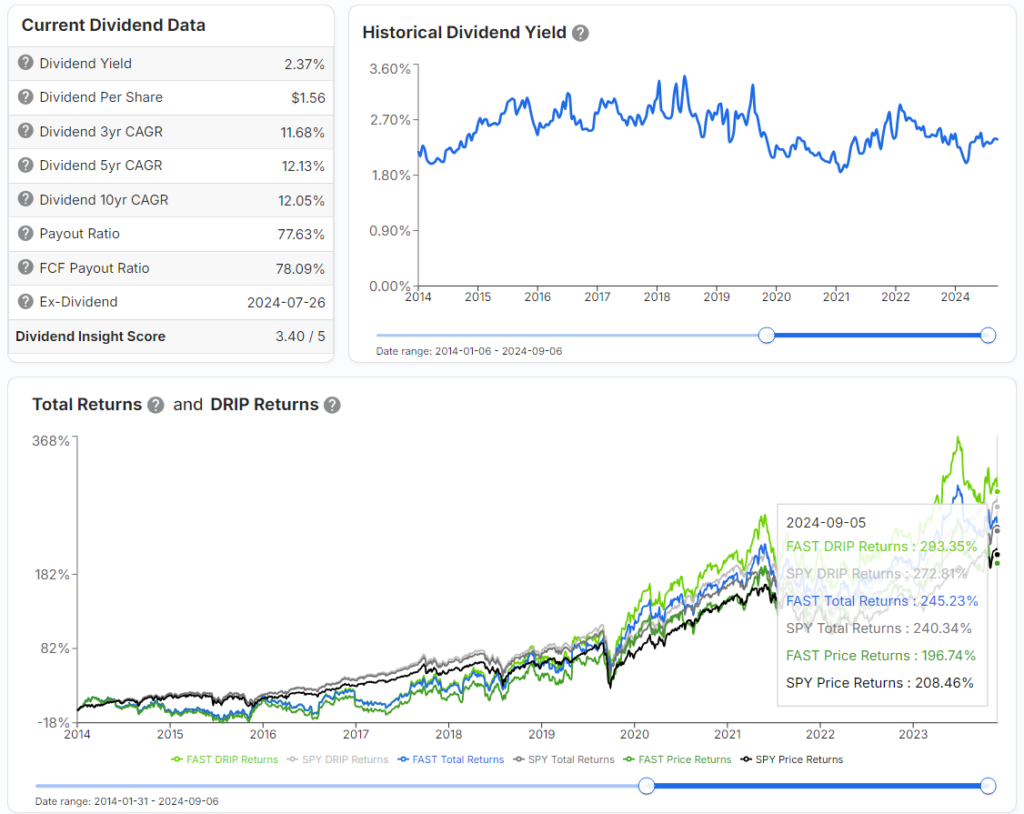
Dividends are part of their total returns but not significantly so. Last year marked the fourth year in their public history that they paid out a special dividend, with the first one being Dec’08 (!!); at that time they felt the cash was their shareholders, they had too much and didn’t know if shareholders had liquidity needs and knew they had more than needed to get through 2009, so they returned it. The other times were in 2012 and 2020. The yield is <3%, but it has boosted total returns:
Stock Unlock: Dividends info for FAST (retrieved Sep’24)
Valuation
Analysts forward estimate
Fwd EPS estimate is a mean of $2.08 for 2024, $69.21 sh price as of Sep 11th means P/E = 33.27x for 2024. With a LTM 2Q24 diluted EPS $2.01, for a P/E of 34.4, so slightly overvalued compared to estimates.
My Basic DCF
Earnings are the most stable indicator for FAST, and so used for my valuation. A lot of the growth in the past 10 years was a result of shifting from own stores (closing down, saving costs), and moving to on customer premises. Led to net income growth of 9.6% CAGR, which accounts for most of the share price return. P/E CAGR was only 1.1% over the past 10 years.
Assuming that earnings growth continues at the current p/e multiple of 33x, it’s just under fair value of $72. That doesn’t leave much of a margin of safety, considering issues noted in the Financial Review. Especially since I think some of the ‘easy’ gains from closing Branch stores have been realized, and now it’s Onsite locations driving growth.
Adjusting inputs to assume slower growth of 7% CAGR for the next 5 years, being some cost savings above 5-6% topline growth, no buybacks (they only do it opportunistically), dividend growth per average, and average p/e of 30x, the FV is $58. If I assume a premium multiple of 33x, the FV is $64. These FV assume a 10% hurdle return and based on LTM 2Q24 earnings of $1,152M.
All this makes me think it is overpriced. So I looked back in time and the last time it was trading around $65 (it’s trading a few bucks higher now) was at the end of 2021. Comparisons are quite telling, they are definitely growing into those lofty expectations:
| YE21 | 2Q24 LTM | |
| P/E (x) | 39.8 | 31.2 |
| P/FCF (x) | 60 | 31.4 |
| ROIC (%) | 29.3 | 33.2 (only breached 30% since 2022) |
| FCF/sh ($) | 1 | 2 |
| FCF ($M) | 614 | 1,146 |
| OCF ($M) | 770 | 1,336 |
Conclusion
I think this is a very well run company, a solid business with sustainably high cash conversion and improving returns. Clearly the shift from Branch to Onsite locations is bearing fruit, and even though it took a decade to complete, management was willing to take the long-view. Based on management’s comments, I believe they value the six key stakeholders: customers, suppliers, employees, owners, the regulators, and the community. They don’t shy away from discussing challenges.
I think this is a company that has earned a premium multiple, and as much as I want to buy shares right now, I feel there may be better entry point, even comparing the improved valuation now versus YE21.
I think the share price is still a little high considering the weak industrial demand. Shares dropped from mid-$70s following the Q2 results, and looking at monthly sales reports published on their website, I don’t think Q3 will be stellar. The whole market is up as of early September and I think that’s what is keeping shares buoyed.
I’ve debated buying some shares now and averaging down, but it’s a toss up. The comparison to 2021 shows they are a larger company now and more worth the current price, and I could argue deserve a premium, but I can’t ignore the sector headwinds. I think the price is ignoring those. Since they report in early October, I’ll reassess and make a decision then.